the Creative Commons Attribution 4.0 License.
the Creative Commons Attribution 4.0 License.
 | 23 Jul 2019
Distribution of phosphorus fractions with different plant availability in German forest soils and their relationship with common soil properties and foliar P contents
Jörg Niederberger
Martin Kohler
Jürgen Bauhus
Repeated, grid-based forest soil inventories such as the National Forest Soil Inventory of Germany (NFSI) aim, among other things, at detecting changes in soil properties and plant nutrition. In these types of inventories, the only information on soil phosphorus (P) is commonly the total P content. However, total P content in mineral soils of forests is usually not a meaningful variable with respect to predicting the availability of P to trees. Here we tested a modified sequential P extraction according to Hedley (1982) to determine the distribution of different plant-available P fractions in soil samples (at depths of 0–5 and 10–30 cm) from 146 NFSI sites, encompassing a wide variety of soil conditions. In addition, we analyzed relationships between these P fractions and common soil properties such as pH, texture, and soil organic carbon content (SOC). The total P content among our samples ranged from approximately 60 to 2800 mg kg−1. The labile, moderately labile, and stable P fractions contributed to 27 %, 51 %, and 22 % of the total P content, respectively, at a depth of 0–5 cm. At a depth of 10–30 cm, the labile P fractions decreased to 15 %, whereas the stable P fractions increased to 30 %. These changes with depth were accompanied by a decrease in the organic P fractions. High P contents were related to high pH values. While the labile Hedley P pool increased with decreasing pH in absolute and relative terms, the stable Hedley P pool decreased in absolute and relative terms. Increasing SOC in soils led to significant increases in all Hedley P pools and in total P. In sandy soils, the P content across all fractions was lower than in other soil texture types. Multiple linear regression models indicated that Hedley P pools and P fractions were moderately well related to soil properties (with r2 values that were mostly above 0.5), and that the sand content of soils had the strongest influence. Foliar P contents in Pinus sylvestris were reasonably well explained by the labile and moderately labile P pool (r2 = 0.67) but not so for Picea abies and Fagus sylvatica. Foliar P contents in all three species could not be related to specific Hedley P pools. Our study indicates that soil properties such as pH, SOC content, and soil texture may be used to predict certain soil Hedley P pools with different plant availability on the basis of large soil inventories. However, the foliar P contents of tree species cannot be sufficiently well predicted by the soil variables considered here.
- Article
(538 KB) - Full-text XML
-
Supplement
(596 KB) - BibTeX
- EndNote


Insufficient or even critical phosphorus (P) nutrition in forest trees has been repeatedly observed in Europe over the last few decades (e.g., Jonard et al., 2015). A large proportion of forest trees that were examined within the framework of the Second National Forest Soil Inventory in Germany (NFSI I-II) showed insufficient P nutrition (20 % of all Picea abies (L.) H. Karst and Pinus sylvestris L. trees sampled and 60 % of all Fagus sylvatica L. trees sampled) (Ilg, 2007; Wellbrock et al., 2016). In contrast to agriculture, where permanent P export is compensated for by fertilization, forest sites in Germany have generally received no P fertilizer in the past – only a very limited number of cases of P fertilization exist (Ilg et al., 2009). There has been some P fertilization to accelerate stand establishment after planting and also admixing of P to dolomitic lime that has been broadcast to compensate for soil acidification due to acid rain (Hoecke, 2006; von Wilpert et al., 2013). In undisturbed forest ecosystems, P cycling is not dominated by input (e.g., deposition) and output (e.g., seepage) processes but by internal recycling (transfer) processes (Newman, 1995). However, even undisturbed forest ecosystems in temperate regions develop a negative P balance in the long term (Smil, 2000; Walker and Syers, 1976). In anthropogenically influenced forest ecosystems, ongoing acidification and nitrogen deposition may lead to nutrient imbalances that affect P nutrition in trees (Duquesnay et al., 2000; Prietzel and Stetter, 2010; Talkner et al., 2015). Furthermore, high levels of ongoing harvest and export of forest biomass may aggravate P malnutrition in trees (Berndes et al., 2003; Kangas and Baudin, 2003).
It has been shown that the total P content in mineral forest soils is not a significant predictor of tree nutritional status, expressed as foliar P content, in different tree species (Ilg et al., 2009). This indicates that most soil P is unavailable or not directly plant available. Correlations between total soil P and foliar P contents have been observed in a few studies, e.g., for P. abies (rs = 0.54) or F. sylvatica (rs = 0.38) (Ilg, 2007). It has been assumed that foliar P may be more closely related to plant available soil P fractions (Ilg, 2007). However, in forests, unlike in many agricultural systems with annual crops, it has been difficult to identify a single measure or fraction of plant available soil P that can sufficiently predict tree nutritional status. This may be related to the many mechanisms that trees have developed to cope with nutrient-poor soils, including mycorrhizal symbioses, root architecture and root exudates supporting uptake of apparently unavailable P stocks, and internal recycling (Fox et al., 2011; Hinsinger, 2001; Hinsinger et al., 2011; Lang et al., 2017; Schachtman et al., 1998).
Other approaches that comprise the quantification of a number of different P fractions in mineral soils have been successfully employed to describe potential sources of P uptake by trees in forest soils. One analytical approach that allows for the partitioning of total P into fractions of different (plant) availability in mineral soils is the Hedley fractionation method (Cross and Schlesinger, 1995; Hedley et al., 1982; Tiessen and Moir, 2008). The original method (Hedley et al., 1982), which was modified by Tiessen and Moir (2008), provides a total of seven inorganic and four organic P fractions. These P fractions are often grouped into pools of distinct plant availability: a labile, fast cycling pool (labile P), which is considered to supply the short-term P demand of plants; a slow cycling pool (moderately labile P), which can be converted into labile P forms; and a pool of occluded P (stable P), which is assumed to hardly contribute to plant nutrition in the short-term (Guo and Yost, 1998; Stevenson and Cole, 1999; Johnson et al., 2003). There are a number of studies that have examined changes in P stocks in forest ecosystems using the Hedley fractionation method. Some of them have followed the development of P fractions over time to gain information on the relevance of these P fractions for tree nutrition during ecosystem development (Richter et al., 2006; De Schrijver et al., 2012). In other studies, the influences of different forest management systems on the distribution of P fractions in soils were investigated (Alt et al., 2011). These were case studies at single sites or only at few different sites and thus had only a limited population of inference (the population to which the results from the sample can be extrapolated) (Binkley and Menyailo, 2005). To our knowledge, no studies have currently addressed the distribution of Hedley P fractions and P pools in forest soils on the basis of large-scale inventories. Thus, there is little information on how different soil variables such as pH value, C and N content, or soil texture, which have been found to influence P availability (Alt et al., 2011; Franzluebbers et al., 1996; Prescott et al., 1992; Silver et al., 2000; Stevenson and Cole, 1999; Thirukkumaran and Parkinson, 2000; Turner et al., 2007), affect the distribution of different P fractions across a variety of forest soil types. Therefore, we determined the Hedley P fractions in mineral soil samples from 145 sites of the National Forest Soil Inventory of Germany, covering a wide range of P contents and many different soil parent materials (Niederberger et al., 2015). With this study we addressed the following questions:
-
How do commonly measured soil properties such as pH value, soil organic carbon content, and soil texture influence the distribution of Hedley P fractions, representing different P pools believed to have different bioavailability?
-
Are the foliar P contents of trees related to specific Hedley fractions, the respective Hedley P pools of soil P, or other soil variables?
2.1 Sites and samples
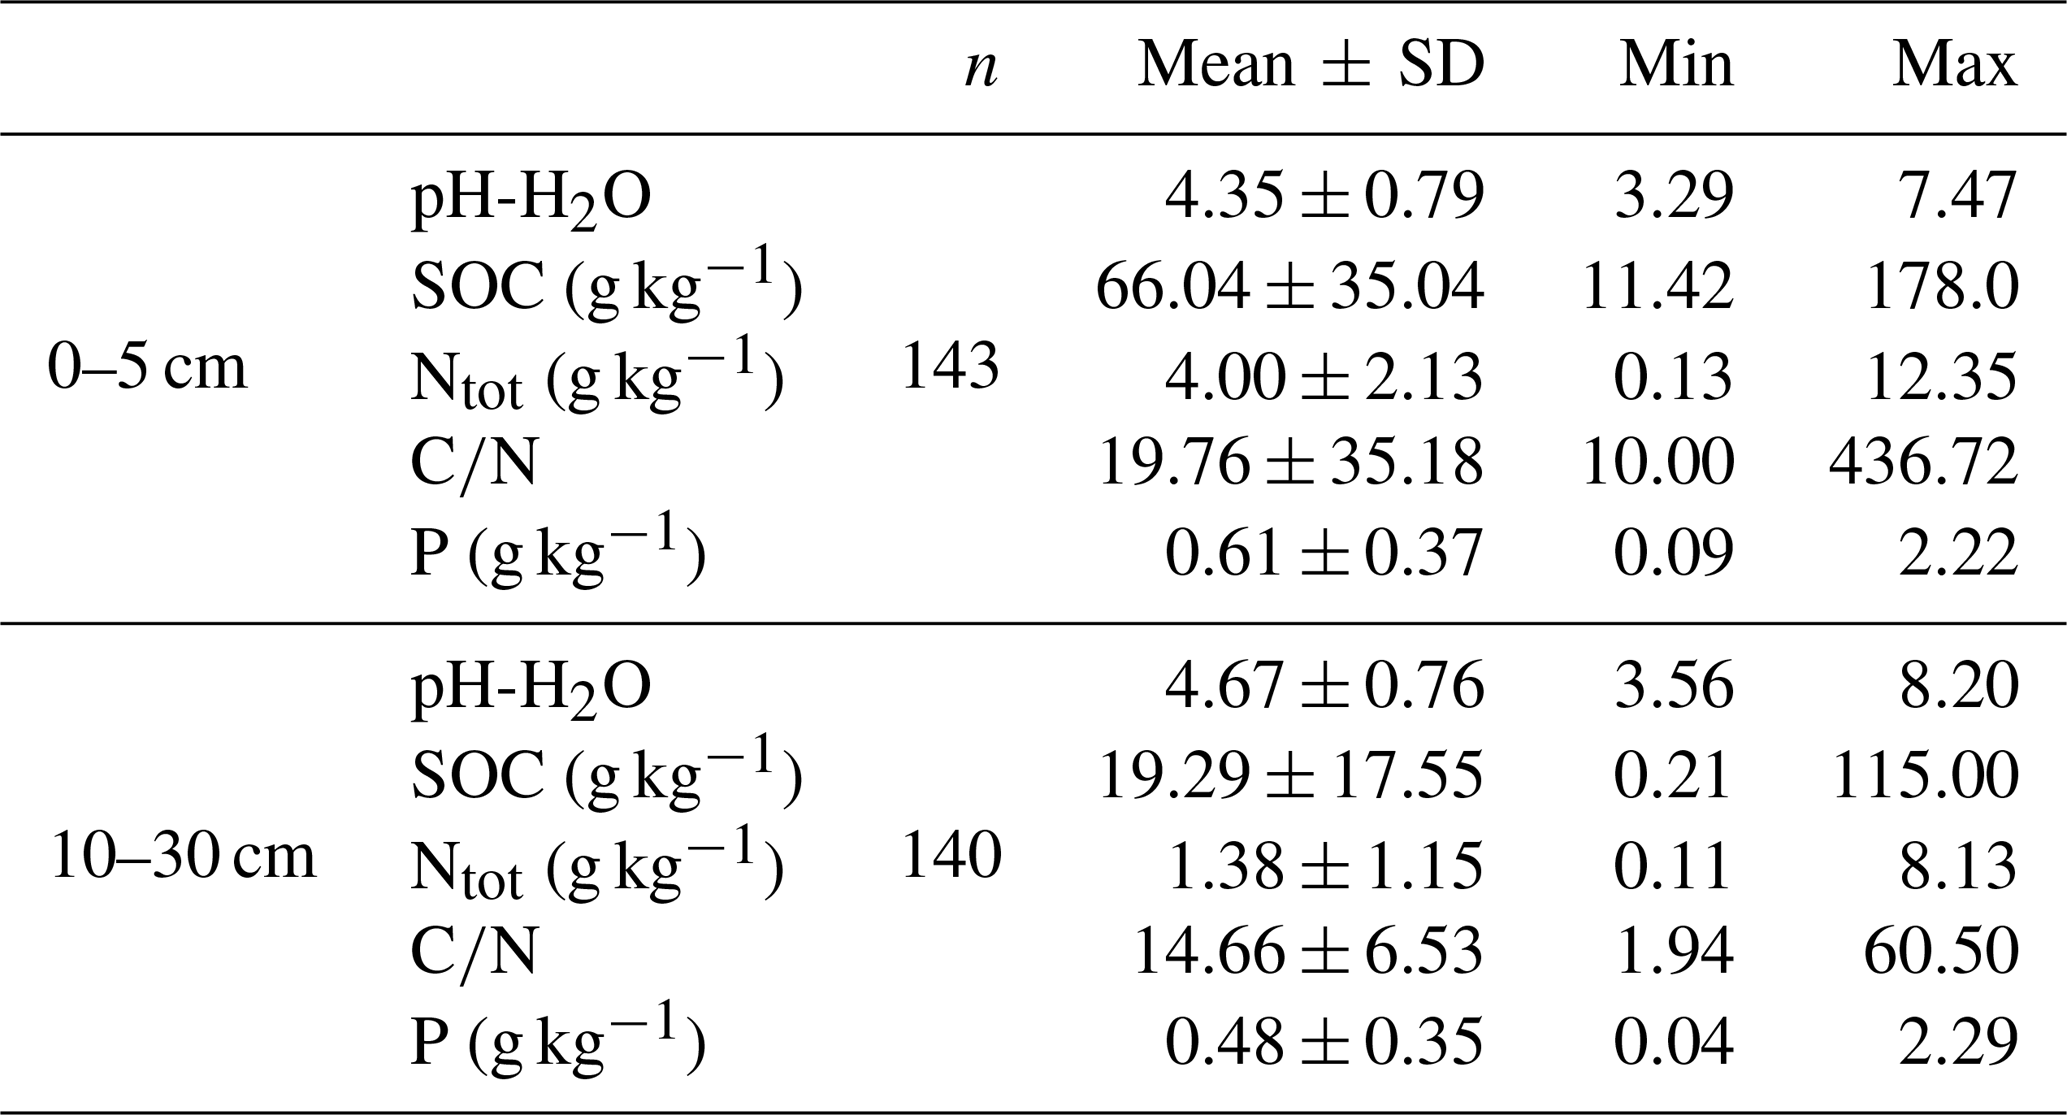
For the purpose of our study, we used archived soil samples from the National Forest Soil Inventories of Germany (NFSI I and II) including samples from the state of Baden-Württemberg that originated from the first NFSI I in 1990, and samples from the states of Hesse, Lower Saxony, and Saxony-Anhalt that originated from the second NFSI II in 2006. In total, 285 archived soil samples from 147 sites (Fig. 1) were included in this study. In most cases, two depths, 0–5 and 10–30 cm, were analyzed for each site. At a depth of 0–5 cm, 145 samples were analyzed, and at a depth of 10–30 cm, 140 samples were available. The selected samples represented a wide range of total P contents (Table 1). Additional soil and site data as well as foliar element concentrations were provided by the Thünen Institute, the Forest Research Institute of Baden-Württemberg, and the Northwest German Forest Research Institute. Here, we used pH value, C and N content (Table 1) and soil type, forest floor type, soil texture, and dominant tree species as predictor variables. Sampling approaches and analytical methods used in the NFSI have been described in detail by Wolff and Riek (1996).
Table 1Variation in selected variables for soil samples from the German Forest Soil Inventory.
To analyze the effects of soil variables on distribution of P across fractions of different plant availability, we classified the samples by their variation in soil properties. To classify them by pH value, we used the buffer ranges suggested by Ulrich (1981). In relation to the SOC content of mineral soil, samples were grouped into classes of “low” (< 1.2 % SOC), “medium” (1.2–2.8 % SOC), “high” (2.8–5.6 % SOC), and “very high” (> 5.6 % SOC) content following the German soil assessment protocol for forest soils (Ad-hoc-Arbeitsgruppe Boden, 2005). Furthermore, we grouped samples into the broad texture classes sand (s), loam (l), silt (u), and clay (t), following the German soil assessment protocol for forest soils (Ad-hoc-Arbeitsgruppe Boden, 2005).

Figure 1Locations of the 147 sample sites from the German Forest Soil Inventory (NFSI) dataset; B represents Baden-Württemberg (n=70), H represents Hesse (n=23), L represents Lower Saxony(n=34), and S represents Saxony-Anhalt (n=20).
For 118 NFSI sites, the foliar P contents of the main tree species (F. sylvatica, P. sylvestris, and P. abies) were available. Foliar P contents for broad-leaved trees were measured in leaves from the upper crown. In conifers, current year needles from the seventh whorl were used. Leaves and needles were collected in the same year as the soil samples.
2.2 Phosphorus fractionation
The P fractionation was carried out using the Hedley method (Hedley et al., 1982) modified by Tiessen and Moir (2008). For this purpose, 0.5 g of soil was repeatedly extracted using different extractants with increasing chemical strength (Fig. 2). A detailed description of the fractionation procedure used in this study is provided in Niederberger et al. (2015, 2016).

Figure 2Sequential P fractionation schema according to Hedley modified by Tiessen and Moir (2008). Gray boxes indicate fractions with organic and inorganic P forms, and the dashed lines separate the Hedley P pools with different availability, following Niederberger et al. (2015).
2.3 Total phosphorus
The NFSI provides the total P contents for individual soil samples, which are determined in different labs employing different analytical methods. In a preliminary study, we found considerable differences between this total P (of the NFSI) and the sum of our Hedley fractions. Therefore, we carried out an additional, independent analysis to determine total P. For comparability with the Hedley fractionation procedure, we used nitric acid digestion to quantify this additional measure of total P. It should be kept in mind though that this analytical procedure might underestimate the real total P content in mineral soils (BMEL, 2014; Schwartz and Kölbel, 1992). This measure of total P content also served as a control to verify the recovery rate of the sum of Hedley P fractions (see also Niederberger et al., 2015).
2.4 Statistical analyses
In a first step, data were analyzed using descriptive statistics. As most of our soil and site data were not normally distributed (Shapiro–Wilk test, p<0.05), we used nonparametric tests to identify significant differences in Hedley P pools or P fractions related to soil properties.
To compare variables between soil depths, we used the paired nonparametric Wilcoxon test. To compare variables among different soil classes within the same soil depth, for instance classes of different SOC content, we used the nonparametric Mann–Whitney U test.
In addition, we used linear regression models to explain Hedley P pools and P fractions with the predictor variables' depth, pH, SOC, and soil type. For modeling soil P content, we applied a log transformation to the Hedley P fractions and P pools. Transformations of the major soil types (sand, loam, silt, and clay) into grain size distribution (expressed as sand content) led to considerable model improvements. To transform soil type information in this way, we used mean values of sand content found in specific soil types based on the German soil assessment protocol for forest soils (Ad-hoc-Arbeitsgruppe Boden, 2005). To assess further model improvements we separated our sample set into calcareous and noncalcareous soils, as we expect strong differences in processes affecting P availability (Prietzel et al., 2014). Despite the large number of sites included in our survey, there were only 8 out of 143 with pH > 6.5. As this number is too low to develop robust statistical models for this collection of samples, we could only test whether model results for the group of soils with pH < 6.5 (noncalcareous soils) changed when calcareous soils were excluded. However, we found only minor improvements as well as some minor deterioration of model quality. Hence, for all further analyses, calcareous soils were not separated from the other soil samples.
Furthermore, we used linear regression models to test whether the foliar P contents of F. sylvatica, P. abies, and P. sylvestris could be explained by the predictor variables' pH, SOC, soil texture, and the soil content of different Hedley P pools and fractions. In addition we calculated models with stocks of total Hedley P and Hedley P pools as predictor variables, to see whether these might improve the statistical models. However, these models based on P stocks were of consistently lower model quality. For that reason, they will not be reported in the results section. Predictor variables used for model building were checked for correlation using Pearson correlation coefficients (r<0.7), for multiple collinearity with VIF (variance inflation factor, < 10) and condition number test (< 30) as well as for autocorrelation (Durbin–Watson statistic). For all regression models, we used the stepwise backward method where nonsignificant predictors (p>0.05) were progressively excluded. All statistical analyses were performed with SPSS 24 (IBM, 2016).
3.1 Total P
The total P content calculated as the sum of all Hedley P fractions ranged from 58 to nearly 2800 mg kg−1 across the 285 NFSI samples. The independently determined total P values (nitric acid digestion) ranged from 42 to nearly 2300 mg kg−1 and were closely related to Hedley P sums (Spearman rs = 0.98, α<0.001). The difference between the two measures of total P was not statistically significant (Wilcoxon paired rank sum test, α=0.05) (Niederberger et al., 2015).
3.2 Distribution of P fractions with soil depth
The sum of stable P fractions (P HClconc and Pi residual) increased with increasing depth, whereas the total P content (as sum of all Hedley fractions) at a depth of 10–30 cm was lower than at a depth of 0–5 cm (Fig. 3). The proportion of total P in the stable Hedley P pool increased with depth (from 22 % to 30 %) while the portion of the labile Hedley P pool decreased (from 27 % to 15 %; Table S1 in the Supplement). The portion of moderately labile Hedley P, although decreasing significantly in absolute value (Fig. S1 in the Supplement), showed no distinct change with depth.
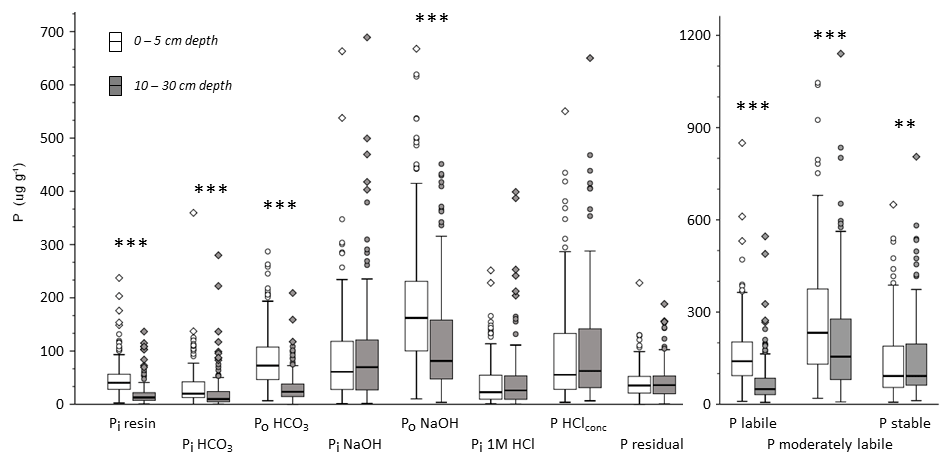
Figure 3Box plots of Hedley P fractions and P pools for all analyzed mineral soil samples separated by depth (all values in mg kg−1). Asterisks indicate significant differences between depths based on a paired nonparametric Wilcoxon test: α<0.001 and α<0.01.
Organic P forms were the largest single fractions within labile and moderately labile Hedley P pools at both depths. At a depth of 0–5 cm, organic P forms contributed even more than the sum of the inorganic forms to these two Hedley P pools (Fig. 3). At a depth of 0–5 cm, contents of all labile P fractions were significantly higher than at a depth of 10–30 cm. While organic P in the moderately labile pool (Po NaOH) decreased with soil depth, this was not the case for inorganic P in this pool (Pi NaOH and Pi 1M HCl). The stable fractions P HClconc and residual Pi showed no significant change with soil depth.

Figure 4Hedley P pools and total P (mean values), grouped by pH classes and soil depths. Lowercase letters indicate significant differences between pH classes within Hedley P pools and per depth (nonparametric Mann–Whitney U test, α<0.05).
3.3 The influence of soil pH on distribution of P fractions
Total P decreased with increasing soil acidity (Fig. 4). This decrease was mainly attributable to a significant decline in the pool of stable Hedley P fractions, which decreased both in absolute as well as relative terms. The portion of stable P dropped from 48.7 % to 16.0 % of total P at a depth of 0–5 cm and from 56.8 % to 26.0 % at a depth of 10–30 cm (Fig. 4). In contrast, the labile P pool in surface soils (0–5 cm) increased significantly in absolute as well as relative terms with increasing acidity. At a depth of 10–30 cm, absolute quantities of labile P remained relatively constant, whereas its relative share of total P increased with increasing acidity (Fig. 4). The moderately labile Hedley P pool showed comparatively small differences between pH classes at both depths; only at a depth of 10–30 cm was this pool significantly smaller in the most acidic soils when compared to other pH classes.
Considering individual P fractions, we found an increase of P content with decreasing pH value at a depth of 0–5 cm for all labile P fractions (Table S2), but this was only significant for the Po HCO3 fraction. At a depth of 10–30 cm, labile P fractions also increased with decreasing pH value up to a maximum at pH 4.2–5.0 but then declined for the most acidic soils (pH 3.0–4.2). At both soil depths, the proportion of the Pi NaOH fraction increased from neutral to acidic conditions, except for the most acidic soil group. While the size of the Po NaOH fraction was unrelated to soil pH at a depth of 0–5 cm, it declined in the most acidic soils at a depth of 10–30 cm. For the Pi 1M HCl fraction we found inconsistent but significant differences among pH classes at depths of 0–5 and 10–30 cm. At both depths, the lowest content was found in the most acidic soils. The two stable P fractions P HClconc and P residual showed clear and consistent significant decreases with decreasing pH at both depths (Tables S2 and S3 in the Supplement).
3.4 The influence of soil organic carbon on the distribution of P fractions
Total P as well as P in all Hedley fractions increased strongly and significantly with increasing SOC content in mineral soil at both depths (Fig. 5). In contrast, the relative proportions of Hedley P pools showed no or only minor changes with increasing SOC at both depths (Fig. S2, Tables S4 and S5).
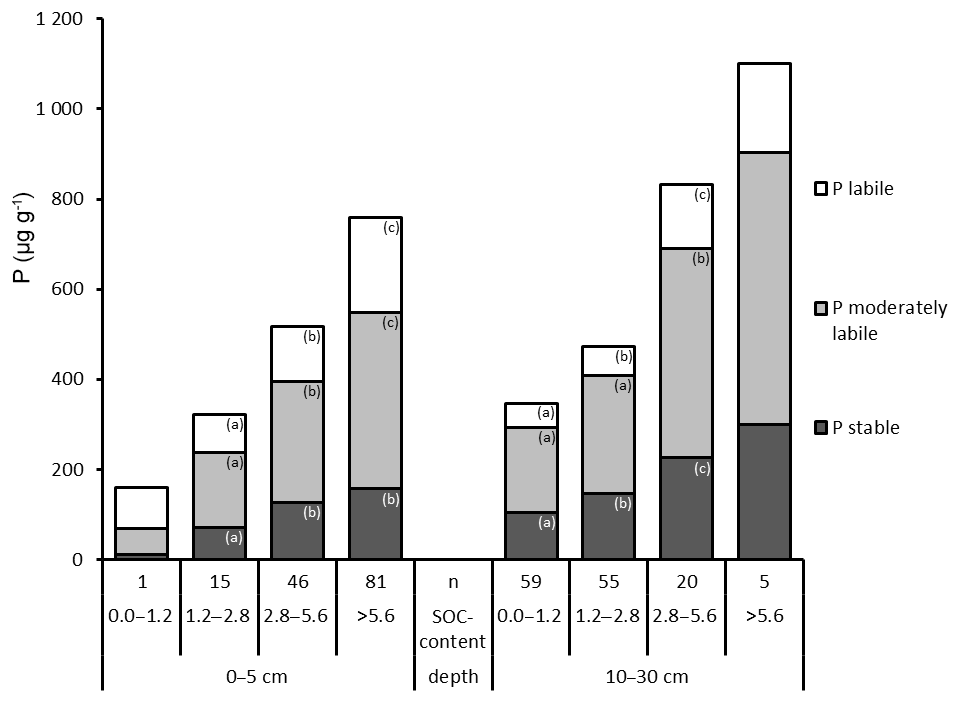
Figure 5Hedley P pools and total P (mean values), grouped by SOC content (in percent; %) and depth. “n” refers to the number of observations, and lowercase letters indicate significant differences in P pools among SOC content classes and per depth based on a nonparametric Mann–Whitney U test, α<0.05. The bar with no letters had too few observations for statistically valid tests of differences.
3.5 The influence of soil texture on P fractions
Total P and in particular the stable Hedley P pool increased with decreasing particle size from sand to clay. The lowest contents of total P and P in the stable and moderately stable fractions were found in sandy soils at both depths (Fig. 6). In particular, the 1M HCl soluble P fractions showed extremely low P contents in sandy soils (Table S6). Accordingly, the highest proportion of labile P was also found in sandy soils: 40 % at a depth of 0–5 cm and 35 % at a depth of 10–30 cm. The proportion of labile P decreased with decreasing grain size. At a depth of 10–30 cm, the increase in total P with increasingly finer soil texture was mainly caused by stable P forms.
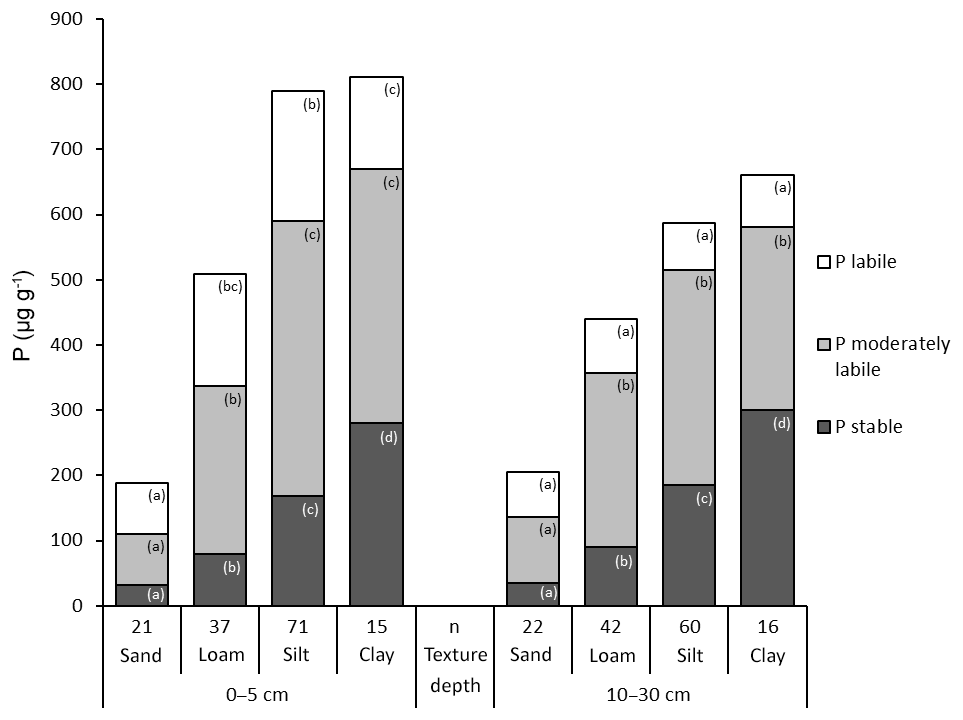
Figure 6Hedley P pools and total P (mean values) grouped by soil texture and depth. “n” refers to the number of observations, and lowercase letters indicate significant differences in P pools among soil texture groups based on a nonparametric Mann–Whitney U test, α<0.05.
3.6 The combined influence of soil variables on the Hedley P pools and P fractions
The best linear regression models were found between soil variables and organic P fractions in labile and moderately labile and stable Hedley P pools, whereas model quality for the inorganic P forms were considerably lower (Table 2). Sand content was a negative predictor in all cases, whereas SOC was always a positive predictor. In contrast, the pH value was a negative predictor for labile P, in particular for labile organic P, but positive for stable P forms.
Table 2Adjusted r2 values and standardized regression coefficients of linear regression models between predictor variables and log transformed Hedley P pools and P fractions for soil samples from a depth of 0–5 cm.
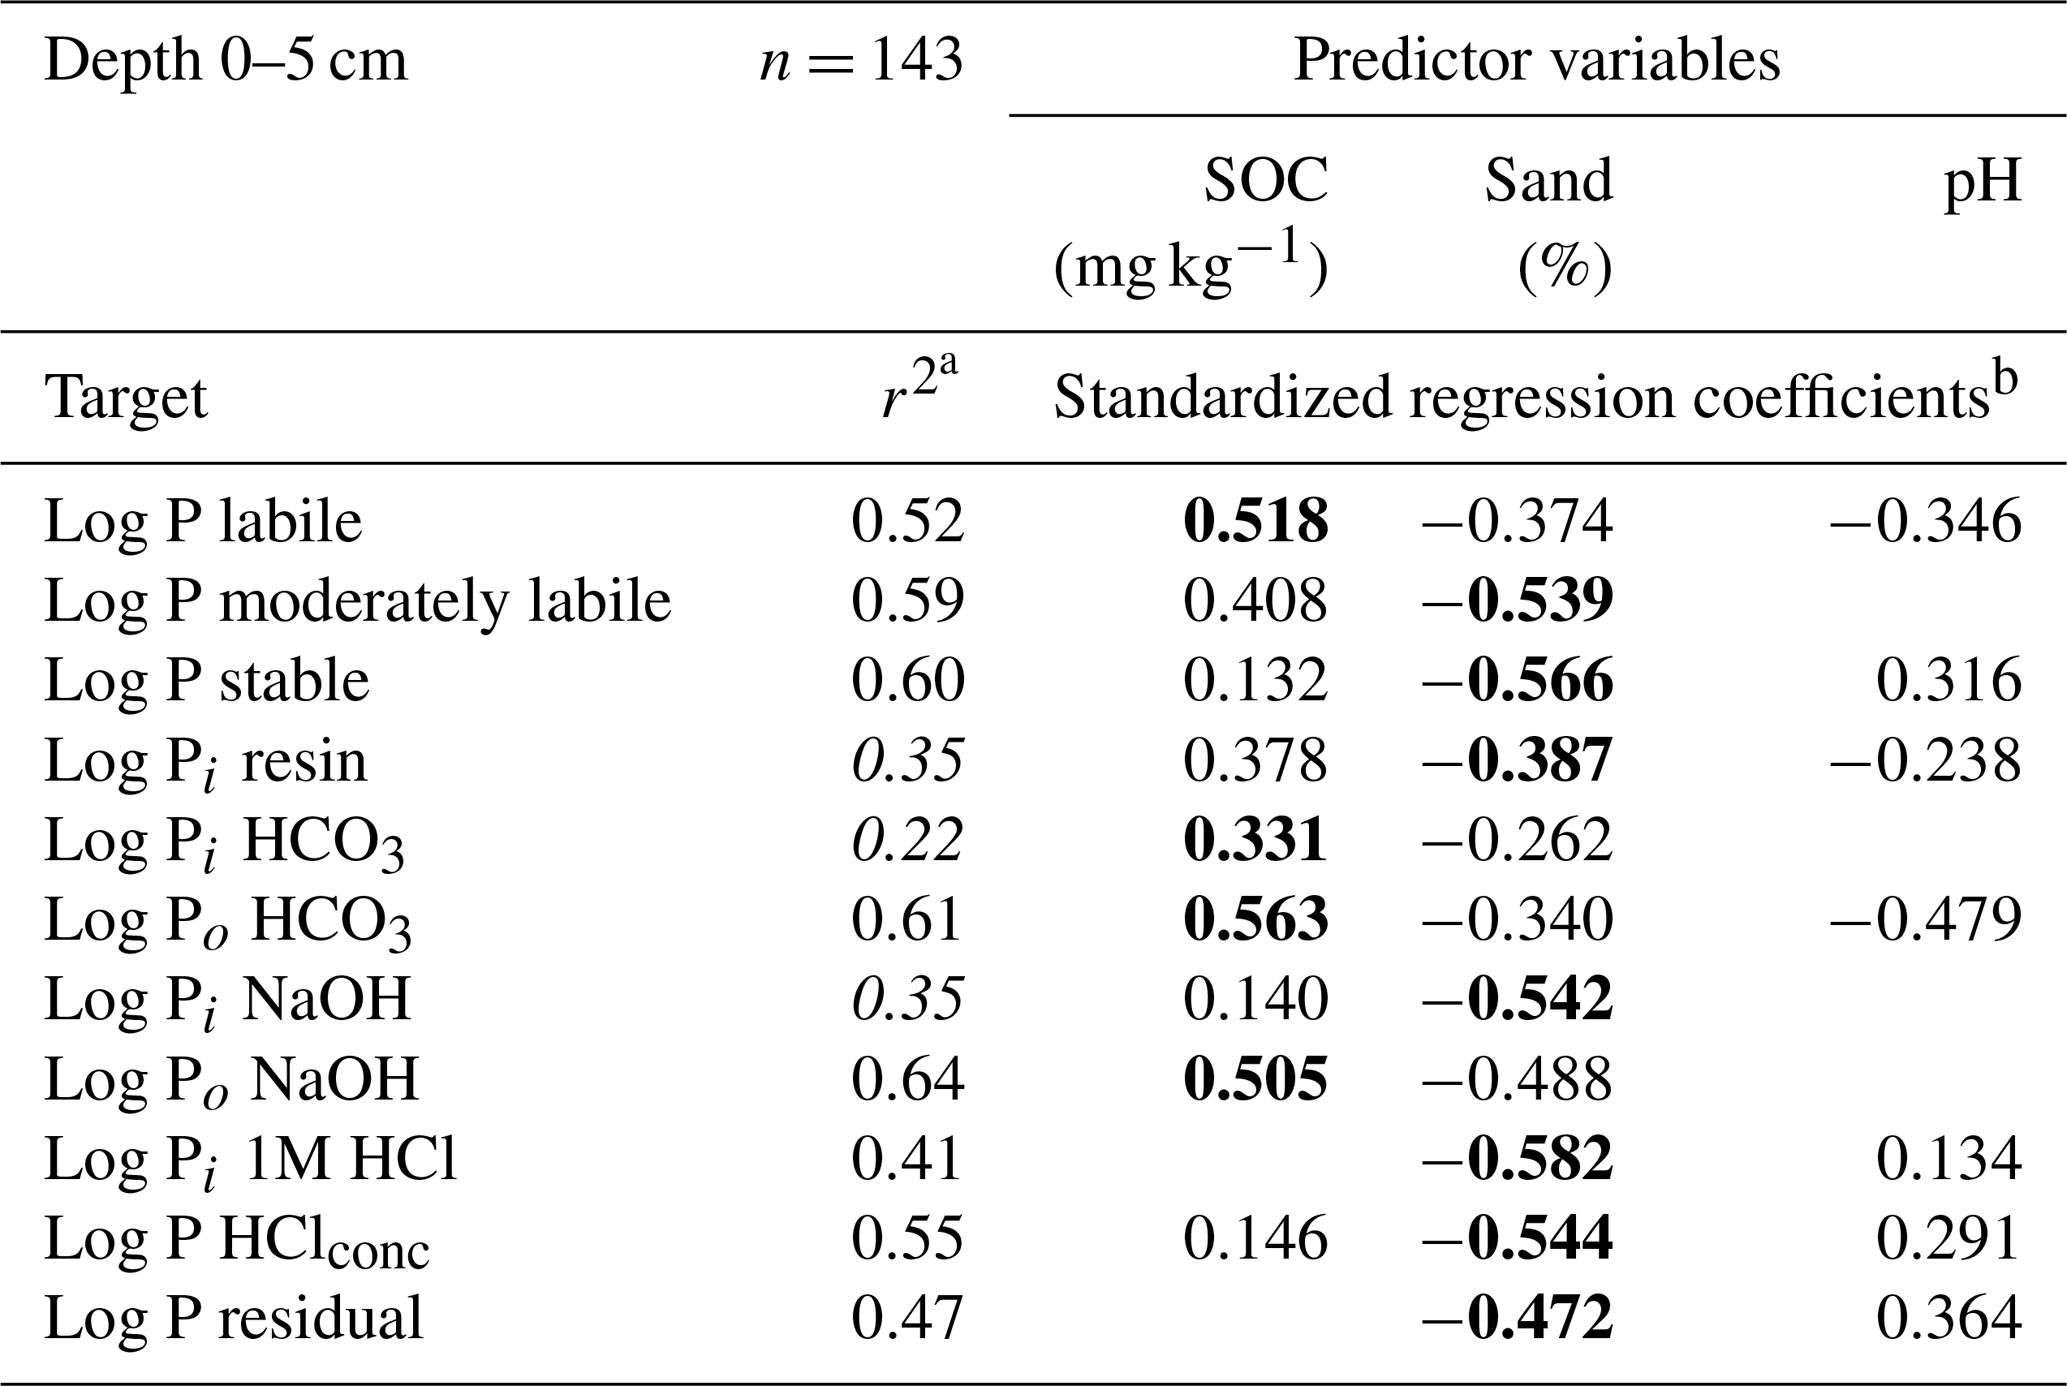
a Adjusted r2, Hedley P pools or P fractions with model performance (r2) below 0.4 are shown in italics. b Significant predictors (p<0.05, F test) are shown, with the strongest predictor presented in bold.
For the labile Hedley P pool and the organic P fractions, the SOC had a stronger influence than the sand content, whereas the reverse was true for stable Hedley P pools. For moderately labile P, both predictors were similarly important, except for the 1M HCl soluble P fraction, where SOC content was not a significant predictor.
Models with a goodness of fit above 0.4 (Table 2) were only obtained for organic P fractions (Po HCO3, Po NaOH) or P fractions with high portions of organic compounds (P HClconc) and fractions which were dominated by soil parent material (P HClconc, P residual). As an exception, the 1M HCl soluble P fraction was the only inorganic P fraction with a model quality above 0.4.
In samples from a depth of 10 to 30 cm (Table S7), we found generally lower model qualities but comparable patterns to those observed at a depth of 0–5 cm.
3.7 The influence of soil variables and Hedley P pools and P fractions on foliar P contents
Total soil P and Hedley P pools with different availability varied considerably between NFSI plots dominated by different tree species (Fig. 7). Under P. sylvestris, all soil Hedley P pools were significantly lower than under F. sylvatica or P. abies; however, the relative proportion of labile P was greatest under P. sylvestris. The differences in Hedley P pools between P. abies and F. sylvatica were mostly small and were only significant for the stable Hedley P pool.

Figure 7Box plots of Hedley P pools and the sum of all Hedley fractions in mineral soils of analyzed NFSI plots for sites dominated by the three main tree species. Different letters indicate significant differences among soils sampled under different tree species for the respective P pool as well as the Hedley P sum in mineral soil (nonparametric Mann–Whitney U test, α<0.05).
The quality of the linear regression models for foliar P content varied considerably amongst the tree species examined. For F. sylvatica and P. abies the adjusted r2 of models did not reach 0.5. In contrast, models to explain foliar P content of P. sylvestris via Hedley P pools and soil variables at a depth of 0–5 cm were of considerably higher quality. Here Hedley P pools were the most important predictors, whereas soil variables only played a minor role. Interestingly, the moderately labile P pool had a negative influence on foliar P content in P. sylvestris at a depth of 0–5 cm. In all multiple linear regression models, at least one of the three soil Hedley P pools was found to be a significant predictor of foliar P content (Table 3), although no specific Hedley P pool was significant in all cases. Remarkably, the SOC content in soils under F. sylvatica was a negative predictor for foliar P content, whereas the SOC content was always a positive predictor for mineral soil Hedley P pools, including labile P (see Sect. 3.4). With the exception of P. abies soil samples from a depth of 0–5 cm, Hedley P pools had a stronger influence on model quality than the other soil variables in all of the other models.
However, the vast majority of the relatively low number of needle samples of P. sylvestris originated from sites with very similar soil properties (same forest floor type, soil texture, soil type, and pH class) and generally very low total P contents (significantly lower than in P. abies and F. sylvatica; Table 2).
Table 3Model quality and standardized, significant regression coefficients of linear regression models to explain foliar P content using Hedley P pools with different availability and other soil variables determined at soil depths of 0–5 and 10–30 cm.
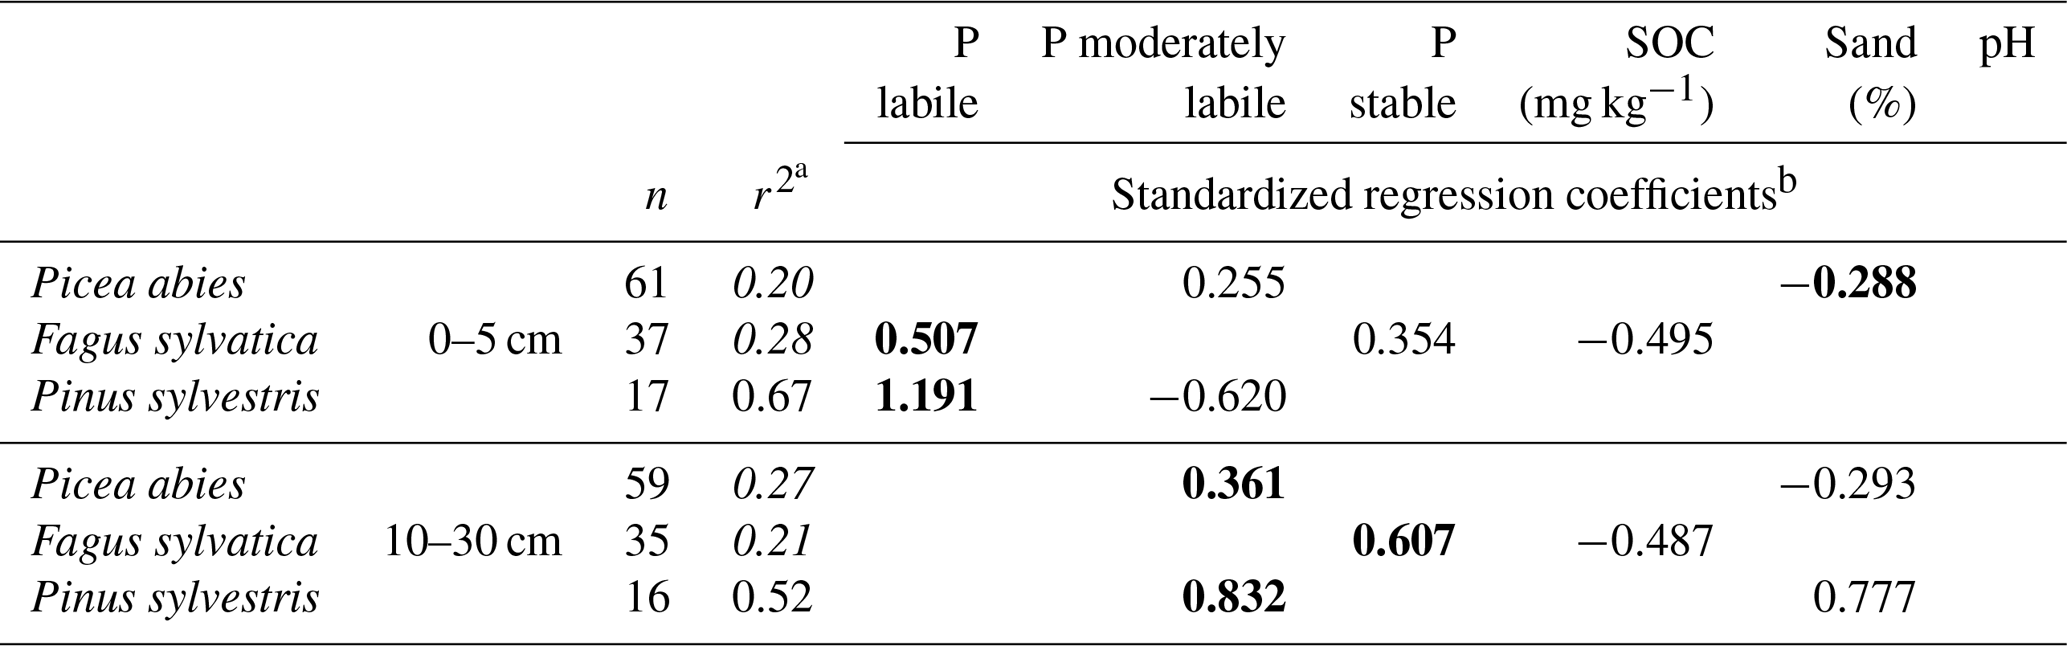
a Adjusted r2, Hedley P pools or P fractions with model performance (r2) below 0.4 are shown in italics. b Significant predictors (p<0.05, F test) are shown, with the strongest predictor presented in bold.
Multiple linear regression models to predict foliar P content in the three tree species with soil variables and P pools from depths of 0–5 and 10–30 cm achieved a moderate quality when applied across the three species (Fig. 8). However, they were not suited to predict foliar P contents when datasets were considered for each of these species separately.
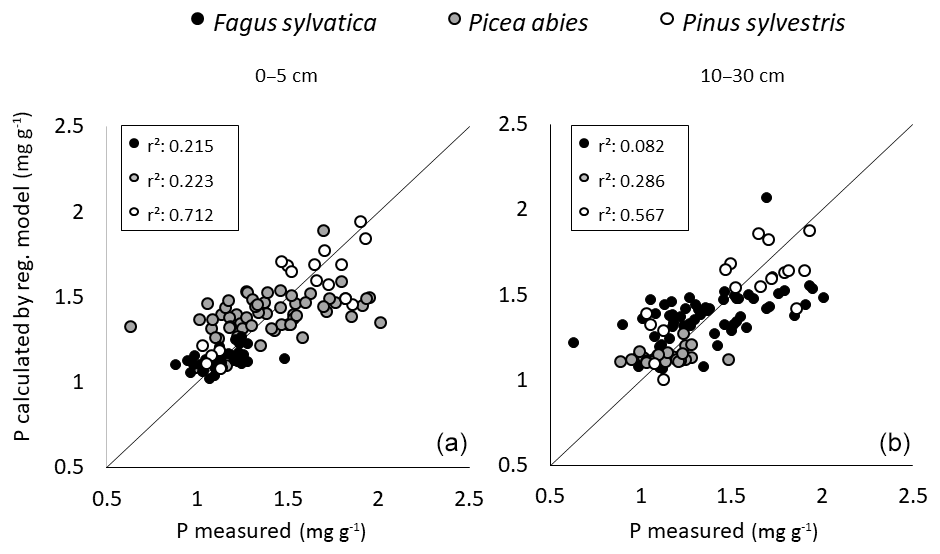
Figure 8Results of multiple linear regressions to predict foliar P content in P. abies, P. sylvestris, and F. sylvatica (see Table 3) with soil variables from depths of 0–5 (a) and 10–30 cm (b); the x axis shows the measured foliar P content, and y axis shows the modeled foliar P content (in mg g−1).
4.1 The influence of soil properties on Hedley P pools and fractions
Our results show that soil properties, like acidity, SOC content, soil texture, and depth, have an important influence on the quantity and distribution of plant-available P in forest soils. However, to date, there have been very few studies that have investigated this issue (Augusto et al., 2017; Buckingham et al., 2010; Shang et al., 1992; Zederer and Talkner, 2018).
In our analysis there was no single soil variable that was consistently the best predictor of the different Hedley pools or fractions. However, there were consistent patterns such as the fact that the SOC content always had a positive influence and sand always had a negative influence. In contrast, the influence of pH, which was never a stronger predictor than either SOC or sand, could be positive or negative. Labile Pi fractions could not be sufficiently well explained (r2>0.4) using the chosen soil variables. They may be more influenced by soil biological processes, which were not captured in our study. In contrast, organic P fractions were well described by the SOC content. Sand content was the strongest predictor of variation in moderately labile and stable Hedley P fractions and pools. This reflects the influence of the soil clay content, which is inversely related to sand content, on these fractions (e.g., Zederer and Talkner, 2018). The magnitude of stable soil P pools was strongly and positively related to pH at both soil depths, whereas the moderately labile pool was, in absolute terms, not strongly affected by soil pH.
In the following discussion, we first address the general assumptions regarding the influence of these variables on the P distribution in mineral soils and relate them to our results. Secondly, we discuss the results of the regression models that were used to examine the relationship between Hedley P pools or fractions and the foliar P content of F. sylvatica, P. abies, and P. sylvestris.
4.1.1 Soil depth
The vertical distribution of P in the soil profile is dominated by biological turnover processes. Plant P uptake and transformation of inorganic into organic P in combination with microbial activity lead to an enrichment in organic and labile P and, in turn, also in total P in the topsoil and forest floor layers (Jobbágy and Jackson, 2001). This could be clearly demonstrated by our results which showed significantly higher amounts of organic P forms and labile Hedley P in the upper soil layer. Furthermore, our findings of a significant decrease in organic P fractions (Po NaHCO3, Po NaOH) with decreasing soil depth are in accordance with earlier studies (Condron et al., 2005; Turner et al., 2003) that described a strong influence of microbial activity on organic P accumulation in the topsoil layers, and a concomitant decrease of Po and SOC with soil depth (Jobbágy and Jackson, 2000).
Our results are also in agreement with the observation of a relative accumulation of more stable inorganic P forms in deeper soil layers by P fixation, for instance as secondary P minerals or in clay minerals (Buckingham et al., 2010; Vitousek et al., 2010). This increase in moderately labile and stable Pi forms was, however, not significant, which may be related to the limited profile depth investigated.
4.1.2 Soil pH
Solubility and fixation of soil P is strongly affected by soil acidity (pH) (Hinsinger, 2001; Shang et al., 1992; Stevenson and Cole, 1999). The optimum availability of P to plants typically occurs around pH 6.5. At a pH value below 6, P is fixed as Fe or Al phosphates or adsorbed to oxide surfaces (Shang et al., 1992; Stevenson and Cole, 1999) and above a pH value of 7, P is fixed in the form of Ca phosphates (Stevenson and Cole, 1999). It has been shown that there are considerable changes in the relative importance of P fractions with pH, even if there is only a minor influence of pH on total P (Turner and Blackwell, 2013). For example, phosphonates were only found in acidic soils, and the amount of P in DNA increased with increasing soil acidity (Turner and Blackwell, 2013). However, specific organic P forms can unfortunately not be picked up by the Hedley fractionation; thus, we could not analyze these pH-related shifts.
In accordance with other studies, the highest portion of labile P was found in the most acidic soil samples (Alt et al., 2011; Turner and Blackwell, 2013). The decrease in labile organic P with increasing pH might be caused by its enhanced mineralization in soils with a more favorable acid–base status for microbes (Stewart and Tiessen, 1987). In contrast to Turner and Blackwell (2013), we observed a positive influence of pH on total P contents at both soil depths. This disagreement between the studies may be attributed to the much larger and more variable dataset used in our study.
The contrasting effects of pH (negative on labile P and positive on stable P forms) might be explained by the different processes that influence P availability and fixation in mineral soils at different pH levels (Hinsinger, 2001; De Schrijver et al., 2012). The negative impact of increasing pH on labile P might be caused by the enhanced decomposition of organic matter by microorganisms at higher pH levels and increased mixing of organic matter with the mineral soil matrix (Paré and Bernier, 1989; Scheffer and Schachtschabel, 2010). Likewise, the positive effect of pH and higher portions of clay minerals on stable P may be explained by the increased fixation of P by clay minerals (Sugihara et al., 2012) and the occurrence of primary and or secondary P-containing minerals in soils at higher pH levels (Hinsinger, 2001).
4.1.3 Soil organic carbon content
As organic P forms can account for more than 50 % of total P in mineral soils (Fox et al., 2011; Stevenson and Cole, 1999; Turner, 2008), we assumed a strong influence of SOC on the distribution of P in mineral soils. In agreement with expectations, total P and all P fractions increased with increasing SOC content, whereas the relative contribution to total P of P in pools of different availability remained stable (Fig. 5). Like other studies, we found a strong positive correlation between SOC and total organic P content (rs = 0.77) in mineral soils (Cleveland and Liptzin, 2007; Perakis et al., 2017; Zederer and Talkner, 2018). In accordance with Johnson et al. (2003), we found an increase in inorganic P fractions with rising SOC content. This increase with SOC may be caused by higher microbial turnover as a source of labile Pi (Condron et al., 2005; Johnson et al., 2003). In our dry, archived samples, the relationship between SOC and Pi, in particular in the labile Hedley P pool, might have been more pronounced owing to microbial P released during the soil drying process (Johnson et al., 2003; Tiessen and Moir, 2008). Our analyses indicated that SOC is a strong positive predictor of labile and moderately labile Hedley P and to a lesser extent also for the stable Hedley P pool.
The rather constant relative proportions of stable, moderately labile, and labile Hedley P pools across soils with different SOC contents (Fig. 5) and the close relationship between SOC and P (Johnson et al., 2003) suggest that these pools may be predicted by SOC content.
4.1.4 Soil texture
The significantly lower P in all Hedley fractions in sandy soils when compared with other soil texture types may be related to lower organic matter content, fewer possible fixation opportunities, e.g., at clay minerals, and higher acidity in these soils. Strong negative correlations between sand content and organic P and strong positive correlations with inorganic P were found in agricultural soils, whereas silt content had the opposite effect (O'Halloran et al., 1985). These were explained by sorption of phosphate monoesters at clay minerals. Likewise, we interpret the negative influence of sand content on total P content in all significant models of our study as the decreasing amount of surfaces to which P could be adsorbed or fixed. As 2:1 clay minerals are able to fix P, the absence of clay minerals can lead to considerably lower P content in sandy soils (Buckingham et al., 2010). Furthermore, it has been shown that sand content had a direct negative influence on the P content in soils of all climate zones worldwide (Augusto et al., 2017). To our knowledge, the effect of texture on P distribution in forest soils has only been described in one publication to date (Zederer and Talkner, 2018). In the forest soils of northern and central Germany, strong positive effects of clay minerals on Po content have been identified (Talkner et al., 2009; Zederer and Talkner, 2018). In soils from NFSI plots under P. sylvestris (Fig. S3), which were mostly located on sandy soils, labile and moderately labile P forms were most strongly influenced by SOC content and in some cases pH, indicating a dominance of microbiological processes, whereas stable P forms were solely influenced by soil type. With increasingly finer soil texture, increased higher total P contents were observed, but this was largely attributable to increases in the stable fraction, whereas there were no or only minor increases in the labile or moderately labile Hedley pools, confirming results from earlier studies (Tiessen et al., 1983, 1984). These results show that the proportion of stable Hedley P pools may be influenced by soil texture in particular.
4.2 Foliar P content in relation to soil variables and Hedley P pools
Nutrient content in leaves and needles are subjected to strong spatial and temporal (inter- and intra-annual) variability (Netzer et al., 2017; Rennenberg and Herschbach, 2013). Therefore, statistical models to explain the foliage nutrient content based on soil properties should be based on a large number of replicate foliage samples to capture the spatial heterogeneity as well as the temporal variation (Wehrmann, 1959), which may be caused by climatic conditions or mast years. Unfortunately, the NFSI only provides data on foliage nutrient content for one point in time, and based on a small sample from three trees per plot (Wellbrock et al., 2016). Therefore, the low quality of our statistical models may be partially caused by the sampling design of the NFSI, and could be improved by collecting foliage samples over several consecutive years (Zederer and Talkner, 2018).
The mean values of Hedley P pools of different availability in forests soils stocked with different main trees species (Fig. 7) indicated considerable differences in P availability. While for P. abies and F. sylvatica, no significant difference in P pools were observed, except for a significantly lower stable Hedley P pool under spruce, there was significantly less P in all pools under P. sylvestris. This raises the question as to whether low foliar P contents in trees can be linked to insufficient amounts of labile P, which is assumed to be plant available in the short term. A rough calculation of labile P in profiles of the NFSI sites suggests that this is not the case. Based on mean stone content and typical bulk densities for these depths, the calculated average stocks of labile P in topsoil (0–30 cm) were 340 kg P ha−1 in P. abies and F. sylvatica stands and about 200 kg P ha−1 in P. sylvestris stands. The estimated average annual uptake demand of about 4 kg P ha−1 by P. abies or 6 kg P ha−1 by F. sylvatica (George and Marschner, 1996) would be easily matched by the P in the labile Hedley pool in all cases. This suggests that either not all labile P is available to trees in the short term or that the foliar P concentrations are not chiefly controlled by P uptake.
However, some earlier studies indicated that there was a correlation, albeit not strong, between total P content in soil and tree nutrition for P. abies (rs 0.54) and F. sylvatica (rs 0.38) (Ilg et al., 2009; Khanna et al., 2007). Other studies showed that P fertilization led to a significant increase in foliar P content (Prietzel and Stetter, 2010). In our study there was no single mineral soil Hedley P pool or soil variable that was consistently the best or a unique predictor of foliar P content in the different tree species. There are several studies using other P extraction methods to explain P foliar content (Manghabati et al., 2018; Prietzel and Stetter, 2010). Prietzel and Stetter (2010) found P extractable with citric acid to be a good predictor to explain P foliar content of P. sylvestris. Manghabati at al. (2018) compared a series of different extractants, including pure H2O, lactate, sodium bicarbonate, citric acid, and aqua regia. They found that needle P content in P. abies was most closely related to soil P extracted with citric acid and sodium bicarbonate. For the P leaf content in F. sylvatica, the total P content was also a good predictor variable, and at some soil depths even the best (Manghabati et al., 2018). Similarly, total organic P and soil clay content were the best predictors (r2=0.6) to model foliar P content in F. sylvatica (Zederer and Talkner, 2018). However, in these studies, the collection of analyzed soils was much less heterogeneous regarding soil types and soil chemical and physical properties. Thus, it is unlikely that the extraction methods or identified P fractions would be strong predictors of P nutrition in trees growing in a wide variety of soils as found in national inventories.
Foliar P contents in F. sylvatica and P. abies were related differently to Hedley P pools and soil properties. Foliar P content in F. sylvatica was explained by SOC content and the stable as well as the labile Hedley P pool, whereas in P. abies, foliar P content was a function of sand content and the moderately labile Hedley P pool. The reason for this might be that the average sand content in mineral soil was twice as high under P. abies as under F. sylvatica. Thus, sites dominated by F. sylvatica had a considerably higher portion of stable organic P forms (P HClconc) which could lead to a negative influence of SOC on P nutrition. The finding that SOC has an important influence on the foliar P content of F. sylvatica corresponds to findings from other studies and also indicates that the forest floor mass or thickness, or nutrient ratios like Corg∕Porg should be included as a variable to improve model quality (Talkner et al., 2015).
Our best multiple linear regression models for foliar P in P. sylvestris reached quality levels (r2=0.67 at 0–5 cm and r2=0.52 at a depth of 10–30 cm) that were comparable to the best model by Zederer and Talkner (2018) for F. sylvatica.
The model results for P. sylvestris indicated that the labile Hedley P pool could have a strong influence on P nutrition. However, the moderately labile P pool for P. abies and P sylvestris and the stable Hedley P pool for F. sylvatica, were also important predictor variables to describe foliar P content. This indicates an important difference between forests and agricultural systems. In forests, P uptake may not only be from the labile but also from the moderately labile or even the stable Hedley P pool (Niederberger et al., 2016). The latter may also replenish the labile Hedley pool during phases of reduced plant P uptake.
The results of the study of Magnhabati et al. (2018) are remarkable because total soil P was as good a predictor of the P nutrient status in F. sylvatica as the P extracted with citric acid or sodium bicarbonate or as the labile Hedley P pool (Zederer and Talkner, 2018; this study). This suggests that the concept of P fractionation with specific extractants to quantify plant-available pools of P is at least questionable. The notion that certain soil P pools or fractions are not suitable as a major or even single predictor of P availability in forest ecosystems is in accordance with recent advances in our understanding of more complex ecosystem processes as important drivers of P nutrition (Lang et al., 2016, 2017). At the same time, a recent study on tropical trees showed that foliar P content may have only limited indication ability for the physiological performance of leaves (Mo et al., 2019). Hence, it may be necessary, if we want to relate soil properties to tree growth, not only to identify soil P fractions crucial for plant nutrition but also P fractions in leaves, such as metabolic P and nucleic acid P, which are sensitive to changes in P availability and closely related to physiological performance.
Using the Hedley fractionation approach, we assessed the distribution of soil P forms of different availability in a range of German forest soils and analyzed relationships between these fractions and selected soil properties. Although our dataset was not representative for German forest sites, it clearly showed that approximately half of the soil P is contained in moderately labile fractions, whereas stable and labile fractions contribute to approximately one-quarter of the total P in the upper mineral soil. With increasing depth, the labile Hedley soil P pool declines in favor of the stable Hedley pool. Common soil properties such as pH, SOC, and soil texture may be used to predict certain Hedley P pools in large forest soil inventories. However, additional soil and site variables should be considered to improve these models.
Despite high quantities of P in labile fractions in mineral soils, which greatly exceed the annual uptake demand of trees, correlations between these fractions and foliar P contents of P. abies and F. sylvatica were not stronger than for moderately labile fractions. Current statistical models using several soil properties and soil Hedley P pools of different plant availability are not capable of adequately explaining the P nutrition status in tree foliage. However, these models may be developed further via the use of larger and more balanced datasets, the incorporation of other important variables such as the forest floor, or by the separate analysis of soils types with very different properties related to P availability (e.g., carbonate soils).
Data are available upon request.
The supplement related to this article is available online at: https://doi.org/10.5194/soil-5-189-2019-supplement.
JN was responsible for the sample acquisition, analysis, and interpretation of data, he made substantial contributions to the conception and design of the study, and is the lead author of the paper. JB conceived the idea for this study. MK and JB contributed to the design of the study as well as to data interpretation and writing the paper.
The authors declare that they have no conflict of interest.
We wish to thank Renate Nitschke and Konstantin Winschu for technical support, and Klaus von Wilpert from the the Forest Research Institute Baden-Württemberg and Jan Evers from the Northwest German Forest Research Station for providing the NFSI samples. We also wish to thank the editors and the three anonymous referees, who helped to improve the paper.
This research has been supported by a grant to Jürgen Bauhus, provided by the Federal Ministry of Food, Agriculture and Consumer Protection (BMELV) administered through the Thünen Institute, Eberswalde, Germany.
This paper was edited by Stuart Grandy and reviewed by three anonymous referees.
Ad-hoc-Arbeitsgruppe Boden: Bodenkundliche Kartieranleitung, edited by: Sponagel, H., Grottenthaler, W., Hartmann, K. J., Hartwich, R., Janetzko, P., Joisten, H., Kühn, D., Sabel, K. J., and Traidl, R.: Bundesanstalt für Geowissenschaften und Rohstoffe, 397 pp., 2005.
Alt, F., Oelmann, Y., Herold, N., Schrumpf, M., and Wilcke, W.: Phosphorus partitioning in grassland and forest soils of Germany as related to land use type, management intensity, and land use related pH, J. Plant Nutr. Soil Sci., 174, 195–209, https://doi.org/10.1002/jpln.201000142, 2011.
Augusto, L., Achat, D. L., Jonard, M., Vidal, D., and Ringeval, B.: Soil parent material – A major driver of plant nutrient limitations in terrestrial ecosystems, Glob. Change Biol., 23, 3808–3824, https://doi.org/10.1111/gcb.13691, 2017.
Berndes, G., Hoogwijk, M., and van den Broek, R.: The contribution of biomass in the future global energy supply: a review of 17 studies, Biomass Bioenerg., 25, 1–28, https://doi.org/10.1016/S0961-9534(02)00185-X, 2003.
Binkley, D. and Menyailo, O.: Gaining insights on th effects of tree spiecies on soils, in Tree Species Effects on Soils: Implications for Global Change, edited by: Binkley, D. and Menyailo, O., Springer the Netherlands, 1–16, 2005.
BMEL: Handbuch Forstliche Analytik, available at: https://www.bmel.de/SharedDocs/Downloads/Landwirtschaft/Wald-Jagd/Bodenzustandserhebung/Handbuch/HandbuchForstanalytikKomplett.pdf;jsessionid=872CF2ECDE8AB94E528624C63BD28E2D.1_cid376?__blob=publicationFile (last access: 16 July 2019), 2014.
Buckingham, S. E., Neff, J., Titiz-Maybach, B., and Reynolds, R. L.: Chemical and textural controls on phosphorus mobility in drylands of southeastern Utah, Biogeochemistry, 100, 105–120, https://doi.org/10.1007/s10533-010-9408-7, 2010.
Cleveland, C. C. and Liptzin, D.: stoichiometry in soil: is there a “Redfield ratio” for the microbial biomass?, Biogeochemistry, 85, 235–252, https://doi.org/10.1007/s10533-007-9132-0, 2007.
Condron, L. M., Turner, B. L., and Cade-Menun, B. J.: Chemistry and Dynamics of Soil Organic Phosphorus, in: Phosphorus: Agriculture and the environment. Agronomy monograph, edited by: Sims, T. J. and Sharpley, A. N., American Society of Agronomy, Crop Science Society of America, Soil Science Society of America, Madison, Wisconsin, 87–122, 2005.
Cross, A. F. and Schlesinger, W. H.: A literature review and evaluation of the Hedley fractionation: Applications to the biogeochemical cycle of soil phosphorus in natural ecosystems, Geoderma, 64, 197–214, https://doi.org/10.1016/0016-7061(94)00023-4, 1995.
De Schrijver, A., Vesterdal, L., Hansen, K., De Frenne, P., Augusto, L., Achat, D. L., Staelens, J., Baeten, L., De Keersmaeker, L., De Neve, S., and Verheyen, K.: Four decades of post-agricultural forest development have caused major redistributions of soil phosphorus fractions, Oecologia, 169, 221–34, https://doi.org/10.1007/s00442-011-2185-8, 2012.
Duquesnay, A., Dupouey, J. L., Clement, A., Ulrich, E., and Le Tacon, F.: Spatial and temporal variability of foliar mineral concentration in beech (Fagus sylvatica) stands in northeastern France, Tree Physiol., 20, 13–22, https://doi.org/10.1093/treephys/20.1.13, 2000.
Fox, T. R., Miller, B. W., Rafael, R., Stape, J. L., and Albaugh, T. J.: Phosphorous Nutrition of Forest Plantations: The role of Inorganic and Organic Phosphorous, in: Phosphorous in Action, edited by: Bünemann, E. K., Oberson, A., and Frossard, E., Springer Berlin/Heidelberg, Berlin, 317–338, 2011.
Franzluebbers, A. J., Haney, R. L., Hons, F. M., and Zuberer, D. A.: Active fractions of organic matter in soils with different texture, Soil Biol. Biochem., 28, 1367–1372, https://doi.org/10.1016/S0038-0717(96)00143-5, 1996.
George, E. and Marschner, H.: Nutrient and water uptake by roots of forest trees, Z. Pflanz. Bodenkunde, 159, 11–21, 1996.
Guo, F. and Yost, R.: Partitioning Soil Phosphorus Into Three Discrete Pools of Differing Availability, Soil Sci., 163, 822–833, 1998.
Hedley, M. J., Stewart, J. W. B., and Chauhan, B. S.: Changes in inorganic and organic soil phosphorus fractions induced by cultivation practices and by laboratory incubations, Soil Sci. Soc. Am. J., 46, 970–976, 1982.
Hinsinger, P.: Bioavailability of soil inorganic P in the rhizosphere as affected by root-induced chemical changes: a review, Plant Soil, 273, 173–195, 2001.
Hinsinger, P., Brauman, A., Devau, N., Gérard, F., Jourdan, C., Laclau, J.-P., Le Cadre, E., Jaillard, B., and Plassard, C.: Acquisition of phosphorus and other poorly mobile nutrients by roots, Where do plant nutrition models fail?, Plant Soil, 348, 29–61, https://doi.org/10.1007/s11104-011-0903-y, 2011.
Hoecke, C.: Langfristige Veränderungen der Bodenvegetation und von Bodeneigenschaften durch Walddüngungen im Nordschwarzwald und auf der Baar, Dissertation Universität Freiburg, 145 pp., 2006.
IBM: SPSS Statistics 24 Core System User's Guide; ftp://public.dhe.ibm.com/software/analytics/spss/documentation/statistics/24.0/en/client/Manuals/IBM_SPSS_Statistics_Core_System_User_Guide.pdf (last access: 19 July 2019), 2016.
Ilg, K.: Machbarkeitsstudie zur Bilanzierung von Phosphor auf Level II – Flächen und ihre Übertragbarkeit auf Standorte der BZE II, 2007.
Ilg, K., Wellbrock, N., and Lux, W.: Phosphorus supply and cycling at long-term forest monitoring sites in Germany, Eur. J. For. Res., 128, 483–492, https://doi.org/10.1007/s10342-009-0297-z, 2009.
Jobbágy, E. G. and Jackson, R. B.: The Vertical Distribution of Soil Organic Carbon and its Relation to Climate and Vegetation, Ecol. Appl., 10, 423–436, 2000.
Jobbágy, E. G. and Jackson, R. B.: The distribution of soil nutrients with depth: Global patterns and the imprint of plants, Biogeochemistry, 53, 51–77, 2001.
Johnson, A. H., Frizano, J., and Vann, D. R.: Biogeochemical implications of labile phosphorus in forest soils determined by the Hedley fractionation procedure, Oecologia, 135, 487–99, https://doi.org/10.1007/s00442-002-1164-5, 2003.
Jonard, M., Fürst, A., Verstraeten, A., Thimonier, A., Timmermann, V., Potočić, N., Waldner, P., Benham, S., Hansen, K., Merilä, P., Ponette, Q., de la Cruz, A. C., Roskams, P., Nicolas, M., Croisé, L., Ingerslev, M., Matteucci, G., Decinti, B., Bascietto, M., and Rautio, P.: Tree mineral nutrition is deteriorating in Europe, Glob. Change Biol., 21, 418–430, https://doi.org/10.1111/gcb.12657, 2015.
Kangas, K. and Baudin, A.: Modelling and projections of forest products demand, supply and trade in Europe, Geneva Timber For. Discuss. Pap., (ECE/TIM/DP/30), vi+198 pp., 2003.
Khanna, P., Bauhus, J., Meiwes, K., Kohler, M., Rumpf, S., and Schönfelder, E.: Assessment of Changes in the Phosphorus Status of Forest Ecosystems in Germany – Literature Review and Analysis of Existing Data. A report to the German Federal Ministry of Food, Agriculture and Consumer Protection, 82 pp., 2007.
Lang, F., Bauhus, J., Frossard, E., George, E., Kaiser, K., Kaupenjohann, M., Krüger, J., Matzner, E., Polle, A., Prietzel, J., Rennenberg, H., and Wellbrock, N.: Phosphorus in forest ecosystems: New insights from an ecosystem nutrition perspective, J. Plant Nutr. Soil Sci., 2015, 129–135, https://doi.org/10.1002/jpln.201500541, 2016.
Lang, F., Krüger, J., Amelung, W., Willbold, S., Frossard, E., Bünemann, E. K., Bauhus, J., Nitschke, R., Kandeler, E., Marhan, S., Schulz, S., Bergkemper, F., Schloter, M., Luster, J., Guggisberg, F., Kaiser, K., Mikutta, R., Guggenberger, G., Polle, A., Pena, R., Prietzel, J., Rodionov, A., Talkner, U., Meesenburg, H., von Wilpert, K., Hölscher, A., Dietrich, H. P., and Chmara, I.: Soil phosphorus supply controls P nutrition strategies of beech forest ecosystems in Central Europe, Biogeochemistry, 136, 5–29, https://doi.org/10.1007/s10533-017-0375-0, 2017.
Manghabati, H., Kohlpaintner, M., Ettl, R., Mellert, K., Blum, U., and Göttlein, A.: Correlating phosphorus extracted by simple soil extraction methods with foliar phosphorus concentrations of Picea abies (L.) H. Karst. and Fagus sylvatica (L.), J. Plant Nutr. Soil Sci., 181, 547–556, https://doi.org/10.1002/jpln.201700536, 2018.
Mo, Q., Li, Z. A., Sayer, E. J., Lambers, H., Li, Y., Zou, B., Tang, J., Heskel, M. A., Ding, Y., and Wang, F.: Foliar phosphorus fractions reveal how tropical plants maintain photosynthetic rates despite low soil phosphorus availability, Funct. Ecol., 33, 503–513, 2019.
Netzer, F., Schmid, C., Herschbach, C., and Rennenberg, H.: Phosphorus-nutrition of European beech (Fagus sylvatica L.) during annual growth depends on tree age and P-availability in the soil, Environ. Exp. Bot., 137, 194–207, https://doi.org/10.1016/j.envexpbot.2017.02.009, 2017.
Newman, E.: Phosphorus inputs to terrestrial ecosystems, J. Ecol., 83, 713–726, available at: http://www.jstor.org/stable/2261638 (last access: 18 March 2019), 1995.
Niederberger, J., Todt, B., Boča, A., Nitschke, R., Kohler, M., Kühn, P., and Bauhus, J.: Use of near-infrared spectroscopy to assess phosphorus fractions of different plant availability in forest soils, Biogeosciences, 12, 3415–3428, https://doi.org/10.5194/bg-12-3415-2015, 2015.
Niederberger, J., Kohler, M., and Bauhus, J.: The relevance of different soil phosphorus fractions for short-term tree nutrition: results from a mesocosm bioassay, Forestry, 90, 258–267, https://doi.org/10.1093/forestry/cpw050, 2016.
O'Halloran, I. P., Kachanoski, R. G., and Stewart, J. W. B.: Spatial Variability of Soil Phosphorus as Influenced by Soil Texture and Management, Can. J. Soil Sci., 65, 475–487, 1985.
Paré, D. and Bernier, B.: Origin of the phosphorus deficiency observed in declining sugar maple stands in the Quebec Appalachians, Can. J. For. Res., 19, 24–34, 1989.
Perakis, S. S., Pett-Ridge, J. C., and Catricala, C. E.: Nutrient feedbacks to soil heterotrophic nitrogen fixation in forests, Biogeochemistry, 134, 41–55, https://doi.org/10.1007/s10533-017-0341-x, 2017.
Prescott, C., Corbin, J., and Parkinson, D.: Immobilization and availability of N and P in the forest floors of fertilized Rocky Mountain coniferous forests, Plant Soil, 143, 1–10, https://doi.org/10.1007/BF00009123, 1992.
Prietzel, J. and Stetter, U.: Long-term trends of phosphorus nutrition and topsoil phosphorus stocks in unfertilized and fertilized Scots pine (Pinus sylvestris) stands at two sites in Southern Germany, Forest Ecol. Manag., 259, 1141–1150, https://doi.org/10.1016/j.foreco.2009.12.030, 2010.
Prietzel, J., Christophel, D., Traub, Ch., Kolb, E., and Schubert, A.: Regional and site-related patterns of soil nitrogen, phosphorus, and potassium stocks and Norway spruce nutrition in mountain forests of the Bavarian Alps, Plant Soil, 386, 151–169, https://doi.org/10.1007/s11104-014-2248-9, 2014.
Rennenberg, H. and Herschbach, C.: Phosphorus nutrition of woody plants: many questions – few answers, Plant Biol., 15, 785–788, https://doi.org/10.1111/plb.12078, 2013.
Richter, D. D., Allen, H. L., Li, J., Markewitz, D., and Raikes, J.: Bioavailability of slowly cycling soil phosphorus: major restructuring of soil P fractions over four decades in an aggrading forest, Oecologia, 150, 259–271, https://doi.org/10.1007/s00442-006-0510-4, 2006.
Schachtman, D., Reid, R., and Ayling, S.: Phosphorus uptake by plants: from soil to cell, Plant Physiol., 116, 447–453, 1998.
Scheffer and Schachtschabel: Lehrbuch der Bodenkunde, 16th Edn., Spektrum Akademischer Verlag, Heidelberg, 569 pp., 2010.
Schwartz, V. and Kölbel, M.: Vergleich verschiedener Aufschlußmethoden zur quantitativen Erfassung der Elementgesamtgehalte in Abhängigkeit von der Bodenausbildung, Z. Pflanz. Bodenkunde, 155, 281–284, 1992.
Shang, C., Stewart, J. W. B., and Huang, P. M.: pH effect on kinetics of adsorption of organic and inorganic phosphates by short-range ordered aluminum and iron precipitates, Geoderma, 53, 1–14, 1992.
Silver, W. L., Neff, J., McGroddy, M., Veldkamp, E., Keller, M., and Cosme, R.: Effects of soil texture on belowground carbon and nutrient storage in a lowland Amazonian forest ecosystem, Ecosystems, 3, 193–209, https://doi.org/10.1007/s100210000019, 2000.
Smil, V.: Phosphorus in the environment: Natural Flows and Human Interferences, Annu. Rev. Energy Environ., 25, 53–88, 2000.
Stevenson, F. J. and Cole, M. A.: Cycles of Soils: Carbon, Nitrogen, Phosphorous, Sulfur, Micronutrients, 2nd Edn., edited by: Stevenson, F. J. and Cole, M. A., Wiley and Sons, Hoboken NJ., 1999.
Stewart, J. W. B. and Tiessen, H.: Dynamics of Soil Organic Phosphorus, Source Biogeochem., 4, 41–60, https://doi.org/10.1007/BF02187361, 1987.
Sugihara, S., Funakawa, S., Nishigaki, T., Kilasara, M., and Kosaki, T.: Dynamics of fractionated P and P budget in soil under different land management in two Tanzanian croplands with contrasting soil textures, Agr. Ecosyst. Environ., 162, 101–107, https://doi.org/10.1016/j.agee.2012.07.019, 2012.
Talkner, U., Jansen, M., and Beese, F. O.: Soil phosphorus status and turnover in central-European beech forest ecosystems with differing tree species diversity, Eur. J. Soil Sci., 60, 338–346, https://doi.org/10.1111/j.1365-2389.2008.01117.x, 2009.
Talkner, U., Meiwes, K. J., Potočić, N., Seletković, I., Cools, N., De Vos, B., and Rautio, P.: Phosphorus nutrition of beech (Fagus sylvatica L.) is decreasing in Europe, Ann. For. Sci., 72, 919–928, https://doi.org/10.1007/s13595-015-0459-8, 2015.
Thirukkumaran, C. and Parkinson, D.: Microbial respiration, biomass, metabolic quotient and litter decomposition in a lodgepole pine forest floor amended with nitrogen and phosphorous fertilizers, Soil Biol. Biochem., 32, 59–66, 2000.
Tiessen, H. and Moir, J. O.: Characterization of available P by sequential extraction, in: Soil sampling and methods of analysis, edited by: Carter, M. R. and Gregorich, E. G., Taylor and Francis Group, Boca Raton Fl, USA, 293–306, 2008.
Tiessen, H., Stewart, J. W. B., and Moir, J. O.: Changes in organic and inorganic phosphorus composition of two grassland soils and their particle size fractions during 60-90 years of cultivation, J. Soil Sci., 34, 815–823, https://doi.org/10.1111/j.1365-2389.1983.tb01074.x, 1983.
Tiessen, H., Stewart, J. W. B., and Cole, C. V: Pathways of phosphorus transformations in soils of differing pedogenesis, Soil Sci. Soc. Am. J., 48, 853–858, 1984.
Turner, B. L.: Resource partitioning for soil phosphorus: a hypothesis, J. Ecol., 96, 698–702, https://doi.org/10.1111/j.1365-2745.2008.01384.x, 2008.
Turner, B. L. and Blackwell, M. S. a: Isolating the influence of pH on the amounts and forms of soil organic phosphorus, Eur. J. Soil Sci., 64, 249–259, https://doi.org/10.1111/ejss.12026, 2013.
Turner, B. L., Cade-Menun, B. J., and Westermann, D. T.: Organic phosphorus composition and potential bioavailability in semi-arid arable soils of the western United States, Soil Sci. Soc., 67, 1168–1179, 2003.
Turner, B. L., Condron, L. M., Richardson, S. J., Peltzer, D. A., and Allison, V. J.: Soil Organic Phosphorus Transformations During Pedogenesis, Ecosystems, 10, 1166–1181, https://doi.org/10.1007/s10021-007-9086-z, 2007.
Ulrich, B.: Ökologische Gruppierung von Böden nach ihrem chemischen Bodenzustand, Z. Pflanz. Bodenkunde, 305, 289–305, 1981.
Vitousek, P., Porder, S., Houlton, B., and Chadwick, O. a: Terrestrial phosphorus limitation?: mechanisms, implications, and nitrogen – phosphorus interactions, Ecol. Appl., 20, 5–15, https://doi.org/10.1890/08-0127.1, 2010.
von Wilpert, K., Hartmann, P., und Schäffer, J.: Regenerationsorientierte Bodenschutzkalkung, Merkblätter der Forstlichen Versuchs- und Forschungsanstalt 54/2013, Freiburg i. Br., 39 pp., 2013.
Walker, T. W. and Syers, J. K.: The fate of phosphorus during pedogenesis, Geoderma, 15, 1–19, https://doi.org/10.1016/0016-7061(76)90066-5, 1976.
Wehrmann, J.: Methodische Untersuchungen zur Durchführung von Nadelanalysen in Kiefernbeständen, Forstwiss. Cent. Bl., 78, 77–97, https://doi.org/10.1007/BF01822233, 1959.
Wellbrock, N., Bolte, A., and Flessa, H.: Dynamik und räumliche Muster forstlicher Standorte in Deutschland. Ergebnisse der Bodenzustandserhebung im Wald 2006 bis 2008, edited by: Wellbrock, N., Bolte, A., and Flessa, H., Johan Heinrich von Thünen-Institiut, Braunschweig, Thünen Report Band 43, 550 pp., https://doi.org/10.3220/REP1473930232000, 2016.
Wolff, B. and Riek, W.: Deutscher Waldbodenbericht 1996: Ergebnisse der bundesweiten Bodenzustandserhebung im Wald von 1987–1993 (BZE), Bd. 1, 1993, 214, available at: https://www.bmel-statistik.de/fileadmin/user_upload/monatsberichte/FHB-0320205-1996.pdf (last access: 18 March 2019), 1996.
Zederer, D. P. and Talkner, U.: Organic P in temperate forest mineral soils as affected by humus form and mineralogical characteristics and its relationship to the foliar P content of European beech, Geoderma, 325, 162–171, https://doi.org/10.1016/j.geoderma.2018.03.033, 2018.