the Creative Commons Attribution 4.0 License.
the Creative Commons Attribution 4.0 License.
 | 07 Oct 2019
Development of a harmonised soil profile analytical database for Europe: a resource for supporting regional soil management
Jeppe Aagaard Kristensen
Thomas Balstrøm
Robert J. A. Jones
Arwyn Jones
Luca Montanarella
Panos Panagos
Henrik Breuning-Madsen
Soil mapping is an essential method for obtaining a spatial overview of soil resources that are increasingly threatened by environmental change and population pressure. Despite recent advances in digital soil-mapping techniques based on inference, such methods are still immature for large-scale soil mapping. During the 1970s, 1980s and 1990s, soil scientists constructed a harmonised soil map of Europe (1:1 000 000) based on national soil maps. Despite this extraordinary regional overview of the spatial distribution of European soil types, crude assumptions about soil properties were necessary for translating the maps into thematic information relevant to management. To support modellers with analytical data connected to the soil map, the European Soil Bureau Network (ESBW) commissioned the development of the soil profile analytical database for Europe (SPADE) in the late 1980s. This database contains soil analytical data based on a standardised set of soil analytical methods across the European countries. Here, we review the principles adopted for developing the SPADE database during the past five decades, the work towards fulfilling the milestones of full geographic coverage for dominant soils in all the European countries (SPADE level 1) and the addition of secondary soil types (SPADE level 2). We illustrate the application of the database by showing the distribution of the root zone capacity and by estimating the soil organic carbon (SOC) stocks at a depth of 1 m for Europe to be 60×1015 g. The increased accuracy, potentially obtained by including secondary soil types (level 2), is shown in a case study to estimate SOC stocks in Denmark. Until data from systematic cross-European soil-sampling programmes have sufficient spatial coverage for reliable data interpolation, integrating national soil maps and locally assessed analytical data into a harmonised database remains a powerful resource to support soil resources management at regional and continental scales by providing a platform to guide sustainable soil management and food production.
- Article
(6895 KB) - Full-text XML
- BibTeX
- EndNote


In a world subject to constant environmental change and increasing population pressure, soil becomes an increasingly important but threatened resource (FAO, 2015; Sustainable Food Trust, 2015). This challenge must be met at multiple management levels and spatial scales; hence, accurate understanding of the available resources at the appropriate scale is required (e.g. Robinson et al., 2017). In spite of advances in digital soil mapping using remote sensing and geographical information systems to infer soil properties (McBratney et al., 2003; Arrouays et al., 2014; Minasny and McBratney, 2016; Zhang et al., 2017), data and standardised methods for large-scale mapping are still inadequate. In particular, the existing methods are challenged in densely vegetated areas and for subsoil properties (Mulder et al., 2011), which are highly relevant to environmental management and food production. This was recently emphasised by the suggesting that the uncertainty in soil data could potentially offset climate change impacts on future crop yields due to the strong climate response dependence on soil type (Folberth et al., 2016). This notion calls for continued efforts to improve soil maps.
During the last century, national soil maps were established in most European countries, but they were not harmonised across borders, as they were based on specific national soil classification systems (Morvan et al., 2008). Therefore, international classification systems were developed during the 1960s and early 1970s to facilitate the compilation of globally standardised soil maps (FAO-Unesco, 1974; SMSS/USDA/AID, 1983). The FAO maps portrayed the soil resources for each individual country as mapping units with a distinct set of soil types, as delineation of individual soil types was not feasible for global-scale soil mapping. The soil types comprised three categories: dominant soils, associated soils and inclusions. The dominant soil type covered the largest proportion of the mapping unit; associated soils occupied 20 % to 50 % of the unit, while the inclusions accounted for less than 20 %. The maps were published with an explanatory text describing the geology, geomorphology and land use and a map showing the level of knowledge behind the map construction, i.e. the level of confidence (King et al., 1994).
In the beginning of the 1980s, the 10 European Community (EC) member states elaborated on the approach defined by the Food and Agriculture Organization of the United Nations (FAO-Unesco) to make an expanded and a more detailed version of the FAO-Unesco (1974) system for the soil types present in their respective countries. Based on this, the EC published seven soil maps (scale of 1:1 000 000; Commission of the European Communities, 1985). The complete soil map of Europe was digitised by the end of the 1980s (Platou et al., 1989) as a part of the EC-financed CORINE programme (Briggs and Martin, 1988). Quickly, it became an important dataset in the forecasting of national crop yields across Europe by the European Commission's Joint Research Centre's Monitoring Agricultural ResourceS (MARS) project (Vossen, 1993). Subsequently, the EC soil map was used widely to underpin soil resource assessments within the European Union (EU), including the mapping of carbon (C) stocks (European Commission, 2005; Jones et al., 2005; Lugato et al., 2014), soil erosion risks (Kirkby et al., 2008; Panagos et al., 2015), vulnerability to compaction (Jones et al., 2003; Schjønning et al., 2015) and salinity (European Commission, 2005) as well to raise awareness and provide education materials (e.g. European Commission, 2005).
Yet such assessments were based on assumptions about the characteristics of each soil type or extrapolations from limited amounts of (often) country-specific analytical data. Therefore, incorporating national datasets into one uniform European database would dramatically increase the quality of predictions and evaluations based on the EC soil map across member state borders. A global attempt to meet a similar challenge has led to the development of the Harmonized World Soil Database (HWSD; FAO/IIASA/ISRIC/ISSCAS/JRC, 2012), in which data from Europe are extracted from the European Soil Database (v.2.0), which in turn is based on the soil profile analytical database for Europe (SPADE). This paper illustrates how this cornerstone (SPADE) in the European Soil Data Centre (ESDA; Panagos et al., 2012) was created based on soil physical and chemical soil data provided for each soil type by national expert stakeholders from each member state. Specifically, we go through how a database containing estimated analytical data for all dominant soil types within the EU with full geographical coverage (SPADE 14) was compiled. Furthermore, we describe how a level-2 database was developed for a small subset of countries to show the principles of how a full coverage level-2 database (SPADE 18) will in the years to come be expanded to cover the entire EU and surrounding countries. Finally, we show how the database can be used to obtain estimates of environmentally relevant soil properties (e.g. root zone capacity and soil organic carbon – SOC – stocks).
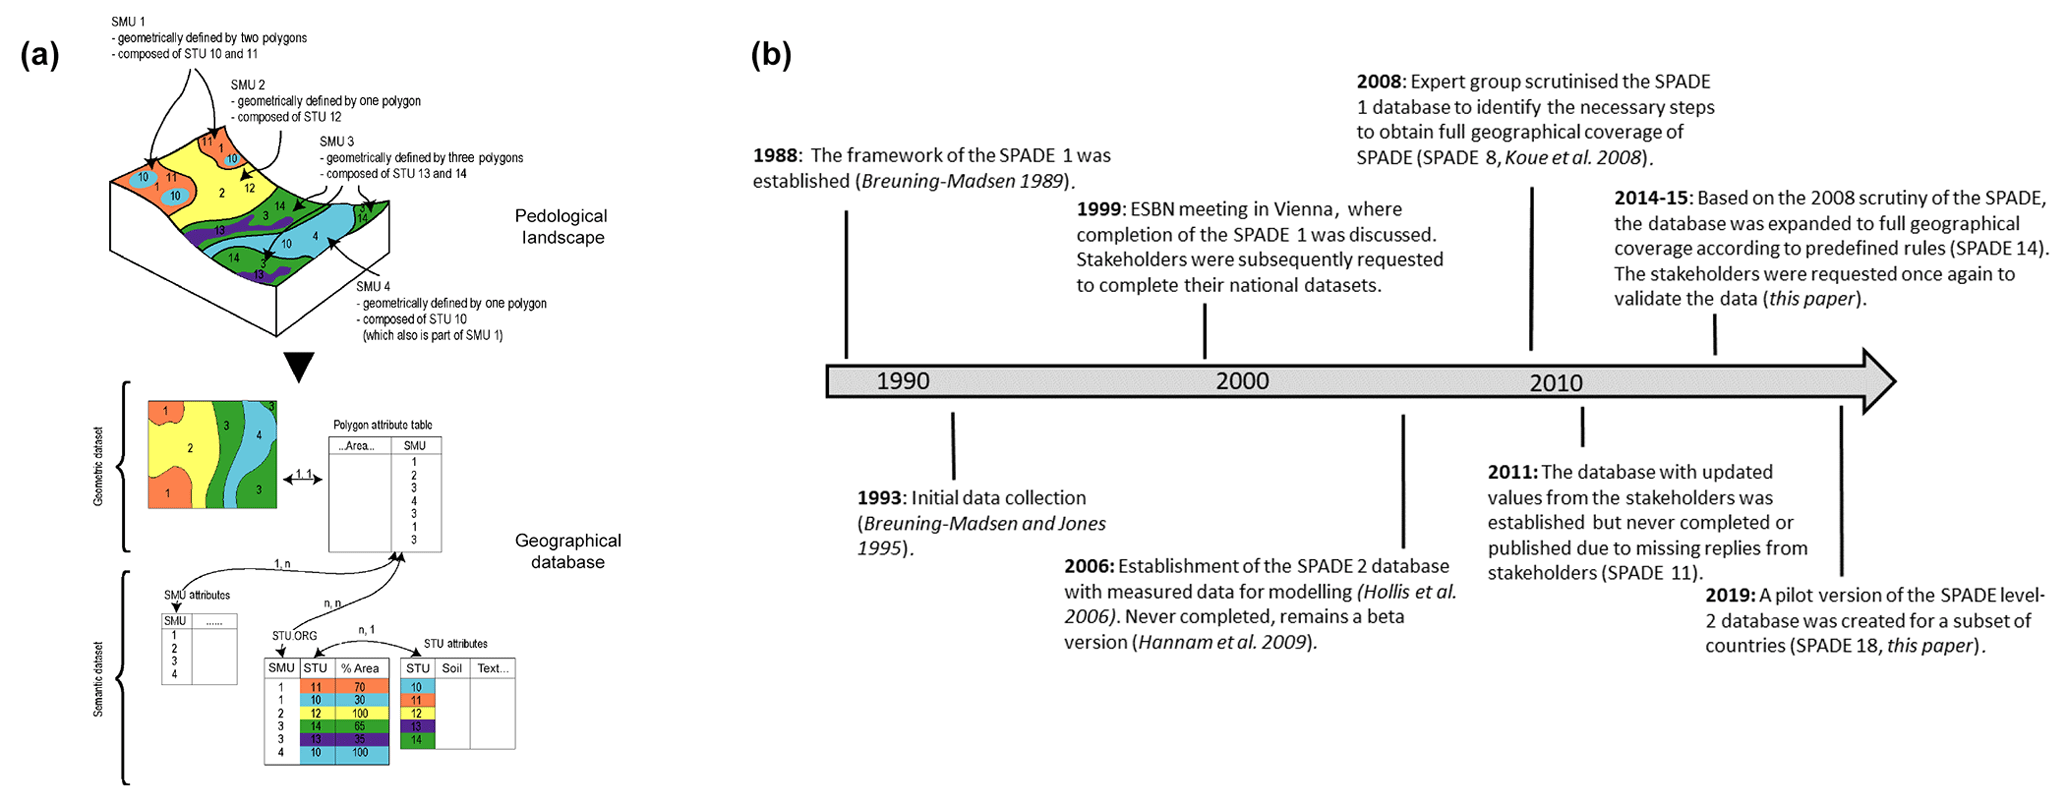
Figure 1(a) Structure of the European Soil Database to which SPADE provides data (after Lambert et al., 2003). (b) Timeline of the establishment of the soil profile analytical database for Europe (SPADE). See text for details.
A working group of Europe-wide soil specialists was formed to advise the Commission of the European Community on the establishment of a soil profile analytical database (SPADE) connected to the EC soil map (Fig. 1a). By the end of the 1980s, the working group proposed that it should be based on four levels of analytical data (Breuning-Madsen, 1989): level 1 would provide analytical data from a typical soil profile for the dominant soil typological unit (STU) in each soil-mapping unit (SMU), preferably on arable land, level 2 would expand the database to include a typical dataset for all STUs, including associated soils and inclusions, level 3 would be a further expansion to include soil analytical data for all soil types with differentiation between land uses, and level 4 would allow different soil analytical data for the same soil type (STU) that occurs in different subregions, e.g. based on geology or geomorphology (see Fig. 1b for a timeline).
Initially, two soil analytical databases were established: one containing estimated mean values for typical soil profiles according to a fixed set of standardised soil analytical procedures provided by national stakeholders (referred to as Proforma I) and another containing soil profile data measured using established yet not necessarily country-wide standardised analytical procedures (referred to as Proforma II). Thus, the Proforma I database contains data comparable across country borders, while this is not always the case for the Proforma II database (Breuning-Madsen and Jones, 1995). In order to make the database functional as soon as possible for the entire coverage area, each member state stakeholder was asked to deliver one full set of Proforma I (estimated) analytical data for each dominant soil type (STU) in each of the SMUs delineated in the soil map of Europe (1:1 000 000). Providing data for the Proforma II (measured) database was made optional to smooth the data collection procedure. Where possible, the data should be provided for agricultural land, as the primary aim of the database was to underpin large-scale assessments of agricultural land management (Breuning-Madsen, 1989; Vossen, 1993).
In 1993, Proforma I and II schemes (including guidelines) were sent to the stakeholders in order to collect data for the individual countries; detailed guidelines for the compilation of the SPADE 1 dataset were published by Breuning-Madsen and Jones (1995).
Subsequently, the SPADE 1 database was expanded to include data from the new EU member states but also from non-EU European nations such as Albania, Norway and Switzerland. By the end of the 1990s, SPADE 1 was subject to a data quality assessment and scrutinised to identify missing data and evaluate overall data reliability. Based on the recommendations presented at a European Soil Bureau Network (ESBN) meeting in Vienna 1999, the national stakeholders were requested to update their individual datasets. Meanwhile, only a few national stakeholders engaged in this exercise due to lack of resources or limitations on data dissemination, which left the SPADE 1 incomplete and not well-suited for modelling at the European level.
Due to the limitations of SPADE 1, SPADE 2 was developed to derive appropriate soil profile data to support, for example, higher-tier modelling of pesticide fate at the European level (Hollis et al., 2006). Data were supplied from national data archives, similar to the SPADE 1 Proforma II. Despite the analytical methods differing between countries, the raw national data were harmonised and validated to provide a single data file for use in conjunction with the existing Soils Geographical Database of Europe (SGDBE; Platou et al., 1989). The primary soil properties required for each soil were horizon nomenclature (e.g. A, E, B and C), upper and lower horizon depth (cm), particle-size distribution (clay, silt, total sand and content of at least three sand fractions), content of coarse fragments (>2 mm), pH in water (1:2.5 soil:water), organic carbon content (%), and dry bulk density (BD; g cm−3).
The acquisition of data happened in two steps: the first datasets were obtained from Belgium, Luxembourg, Denmark, England and Wales, Finland, Germany, Italy, the Netherlands, Portugal, and Scotland (Hollis et al., 2006), and next the database was expanded with data from Bulgaria, Estonia, France, Hungary, Ireland, Romania, Slovakia, Spain, France and Ireland. Due to the lack of methodological consistency between countries, the final database (SPADE2v11) was never published; hence it only exists as a beta version of collated datasets from the first and second phases of soil profile data acquisition (Hannam et al., 2009). However, it was used to estimate bulk densities for missing data in the later SPADE 14 (see Fig. 1b for timeline and overview of the SPADE versions).
In an effort to obtain a functional database with full spatial coverage for Europe, a small specialist group from Denmark (Henrik Breuning-Madsen, Thomas Balstrøm and Mads Koue from the Institute of Geography, University of Copenhagen) assessed the national datasets in 2008 using error finding equations based on literature values, expert judgements and pedotransfer functions (Koue et al., 2008).
First, a quality check was conducted on all data. This process consisted of the following:
- i.
cross-checking of interdependent variables (e.g. pH vs. base saturation or porosity vs. saturated water content),
- ii.
checking the plausibility of all values according to published theoretical or empirical values (e.g. for bulk density – BS – or C:N values).
Examples of common questionable data were occurrences of bulk soil C:N values <5, mismatches between BS and pH (e.g. BS>90 % at pH<4.5), and volumetric water content at saturation exceeding the porosity. Based on this examination, implausible values were either adjusted to plausible values or marked as unlikely based on predefined criteria. All changes and suggestions were carefully flagged to make them obvious to national evaluators. However, in terms of spatial extent, it was still only possible to link a soil analytical dataset for a dominant soil type to approximately 70 % of the SMUs in the area covered by the database.
At an ESBN meeting in Paris in December 2008, the reviewed SPADE 8 database was discussed, and following the meeting, the national evaluation reports and the country-specific databases were sent to the national stakeholders with a request to (i) review and change the existing data to plausible values based on the expert scrutiny and (ii) estimate new datasets for the dominant soil types without data based on their local expertise. The modifications received from the stakeholders were incorporated in the SPADE 8 database, which was renamed SPADE 11. However, once again the data received from national stakeholders were inadequate, which still left the database incomplete, so SPADE 11 remained unpublished work in progress.
Without further input from the national stakeholders, implausible data identified in SPADE 8 were estimated to make the Proforma I (level 1) database more functional for modelling. Thus, starting in 2014, the SPADE 8 database was updated by a working group consisting of the authors of the current paper.
Specifically, this work package had three key goals:
- i.
to implement the suggested improvements of the existing data in the SPADE database suggested during the 2008 evaluation;
- ii.
to estimate values for the profiles lacking data (approximately 32 % of the dominant STUs) based on matching of similar soil types in neighbouring countries, the data in SPADE 2 or other reference data sources;
- iii.
to update the existing SPADE database with the complete dataset after revision by the national stakeholders.
The resulting SPADE14 database is publicly available through JRC's ESDAC website (https://esdac.jrc.ec.europa.eu/content/spade-14, last access: 1 October 2019).
Firstly, the questionable values identified in SPADE 8, but not corrected by stakeholders, and were adjusted to fit theoretical or average values according to predefined equations or guidelines (see below and Breuning-Madsen et al., 2015). Secondly, data for profiles lacking stakeholder-estimated values were assigned by copying complete datasets from identical soil types in neighbouring countries. If no matching profiles were identified, the search was extended to the entire database. Thirdly, data for the remaining ∼15 % of the dominant soil types (STUs for which no estimated data existed anywhere in the database) were created by adjusting existing data from similar soil profiles, preferably from the country itself or neighbouring countries to minimise variation due to climate and parent material. The evaluation guidelines sent to the stakeholders during the SPADE 14 evaluation provided a detailed description of the methodology and an overview of all modifications made, with the suggested changes properly flagged with colour coding of adjusted values depending on the nature of the change (Breuning-Madsen et al., 2015). The entire database was quality controlled with the updated versions of equations and guidelines used during the 2008 evaluation, thus ensuring consistency across member states. Finally, the quality-controlled national data were sent to each stakeholder for final checking and revision. The changes suggested by stakeholders were incorporated before publication.
5.1 Examples of correction guidelines
For some parameters, no correction guidelines were specified during the 2008 evaluation, in which case they were developed during the 2014–2015 evaluation. As examples, the estimation of bulk density and volumetric water content are elaborated below.
5.1.1 Bulk density
Missing BD values were assigned the average of all measured values from the SPADE 2 depending on their OM and depth (Table 1). For soil horizons with organic matter (OM) content >10 %, BD values were calculated from the OM content grouped into 10 % intervals. For soils with OM contents <5 %, BD values were averaged over depth intervals of 25 cm down to 100 cm. Deeper horizons were assigned a value of 1.5 g cm−3 unless geomorphology or overlying horizons indicated a significantly different value. For soils with OM contents between 5 % and 10 %, the BD was estimated to be a value in the range 1.1–1.2 g cm−3 based on surrounding horizons and profiles and whether it was in the high (∼10 %) or low (∼5 %) OM range.
Table 1Average bulk densities calculated from the SPADE 2 database. The mean, standard deviation and the number of observations (n) are shown.
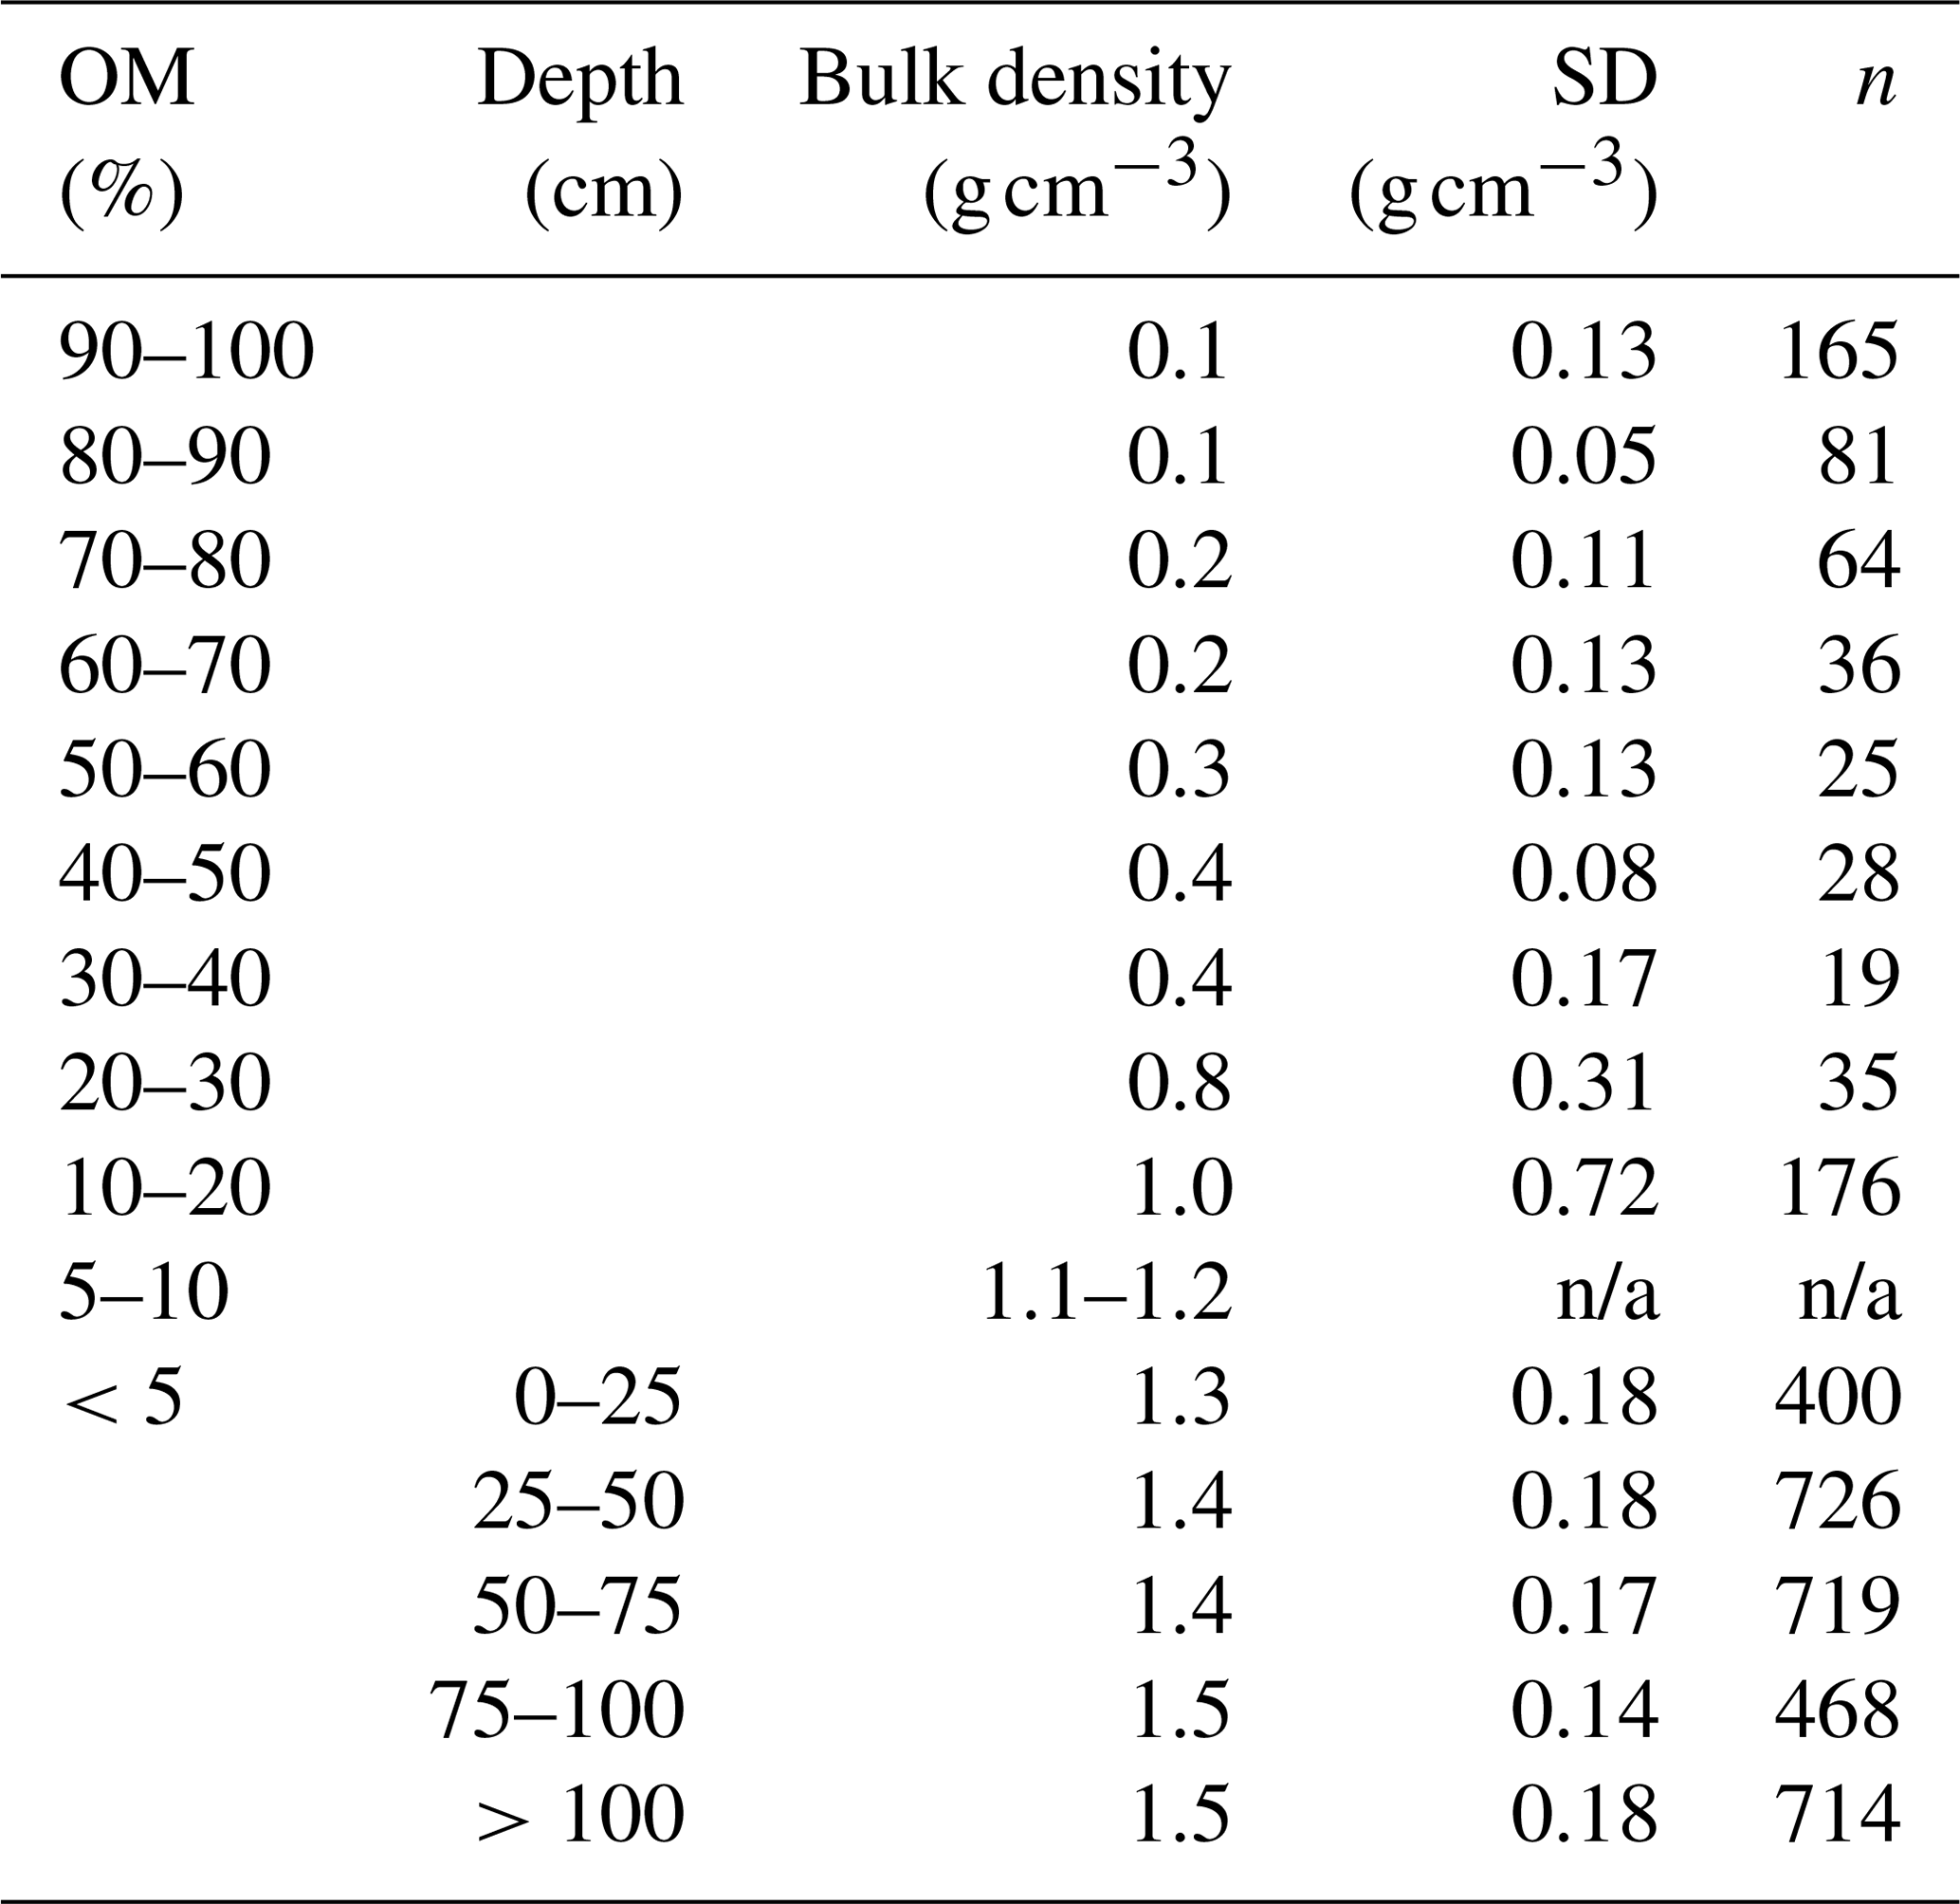
n/a: not applicable
5.1.2 Volumetric water content (VWC)
National stakeholders were requested to specify the water content at 1, 10 (field capacity), 100 and 1500 kPa suction for each soil horizon, enabling the calculation of functions such as root zone capacity, i.e. plant-available water to a specified root depth, which could be 50 cm for grasses, 100 cm for barley and up to 200 cm for wheat (e.g. Jensen et al., 1998). In order to assign realistic data to missing estimates, we regressed (multivariate linear regression) water-retention data, i.e. VWC (volumetric water content) at 1, 10, 100 and 1500 kPa suction, from countries with complete datasets against multiple explanatory variables: BD, particle-size fractions (TEXT – % mass; < 2 µm = TEXT2; 2–20 µm = TEXT20; 20–50 µm = TEXT50; 50–200 µm = TEXT200; 200–2000 µm = TEXT2000) and organic matter content (OM – % mass). Member states with complete datasets were Belgium, the United Kingdom (UK) and Denmark. As data from Denmark were used for validation, the derived equations were based on data from Belgium and the UK. Fluvisols were omitted, as they often have complicated water-retention properties due to their geomorphological origin. Only 7 % (9 of 132) of the observations from Denmark deviated more than 10 % VWC from the 1:1 line between observed and calculated values using the linear models. The adjusted correlation coefficients were 0.85, 0.86, 0.87 and 0.91 for VWC1, VWC10, VWC100 and VWC1500, respectively (P<0.001), and the resulting regression equations were as follows:
5.2 Traceability and quality check
In order to ensure traceability of all proposed changes, we developed a colour-coding system for the Excel spreadsheets submitted to stakeholders that allowed them to identify the kind of changes that had been applied to each data element (Breuning-Madsen et al., 2015; Koue et al., 2008). Moreover, a tracing document kept track of whether the dominating STUs contained original stakeholder-estimated data, a dataset copied from another profile in the database or a dataset modified by the working group. For this dataset, a separate tracing document kept track of profiles and parameters modified to anticipate potential criticism and controversy by national stakeholders, who were, however, always encouraged to change and improve their national datasets. Finally, the data quality was evaluated prior to the modifications, and a new cross-database check was introduced to make sure that the topsoil texture class specified in the estimated profile database matched the actual topsoil texture class specified in the estimated horizon database. When inconsistencies were identified, the topsoil texture class in the estimated horizon database was adjusted accordingly (Breuning-Madsen et al., 2015).
5.3 Evaluating, updating and publishing the SPADE 14 database
Table 2 provides an overview of the origin of the data for each country. The first column (original SPADE 8) shows how many profiles were available from both SPADE 1 and 8. The second column (SPADE 14 – profiles from other countries) shows how many profiles were copied from other countries, and the third column (SPADE 14 – modified profiles) shows how many profiles were created by the working group by adjusting existing profiles in order to complete the national datasets with suggested values.
Table 2The origin of SPADE data at the national level. “Original” shows the soil profiles for which the stakeholders originally provided data, “Profiles from other countries” show the soil profiles for which data were copied and pasted from a similar country, “Modified profiles” show the soil profiles to which slight adjustments were made, “Level-1 total” shows the total number of dominating soil profiles, which are available in the current database (SPADE 14), and “Level-2 total” shows the total number of profiles when associated soil types were included. The datasets for associated soils will be available when the level-2 database (SPADE 18) is fully developed.
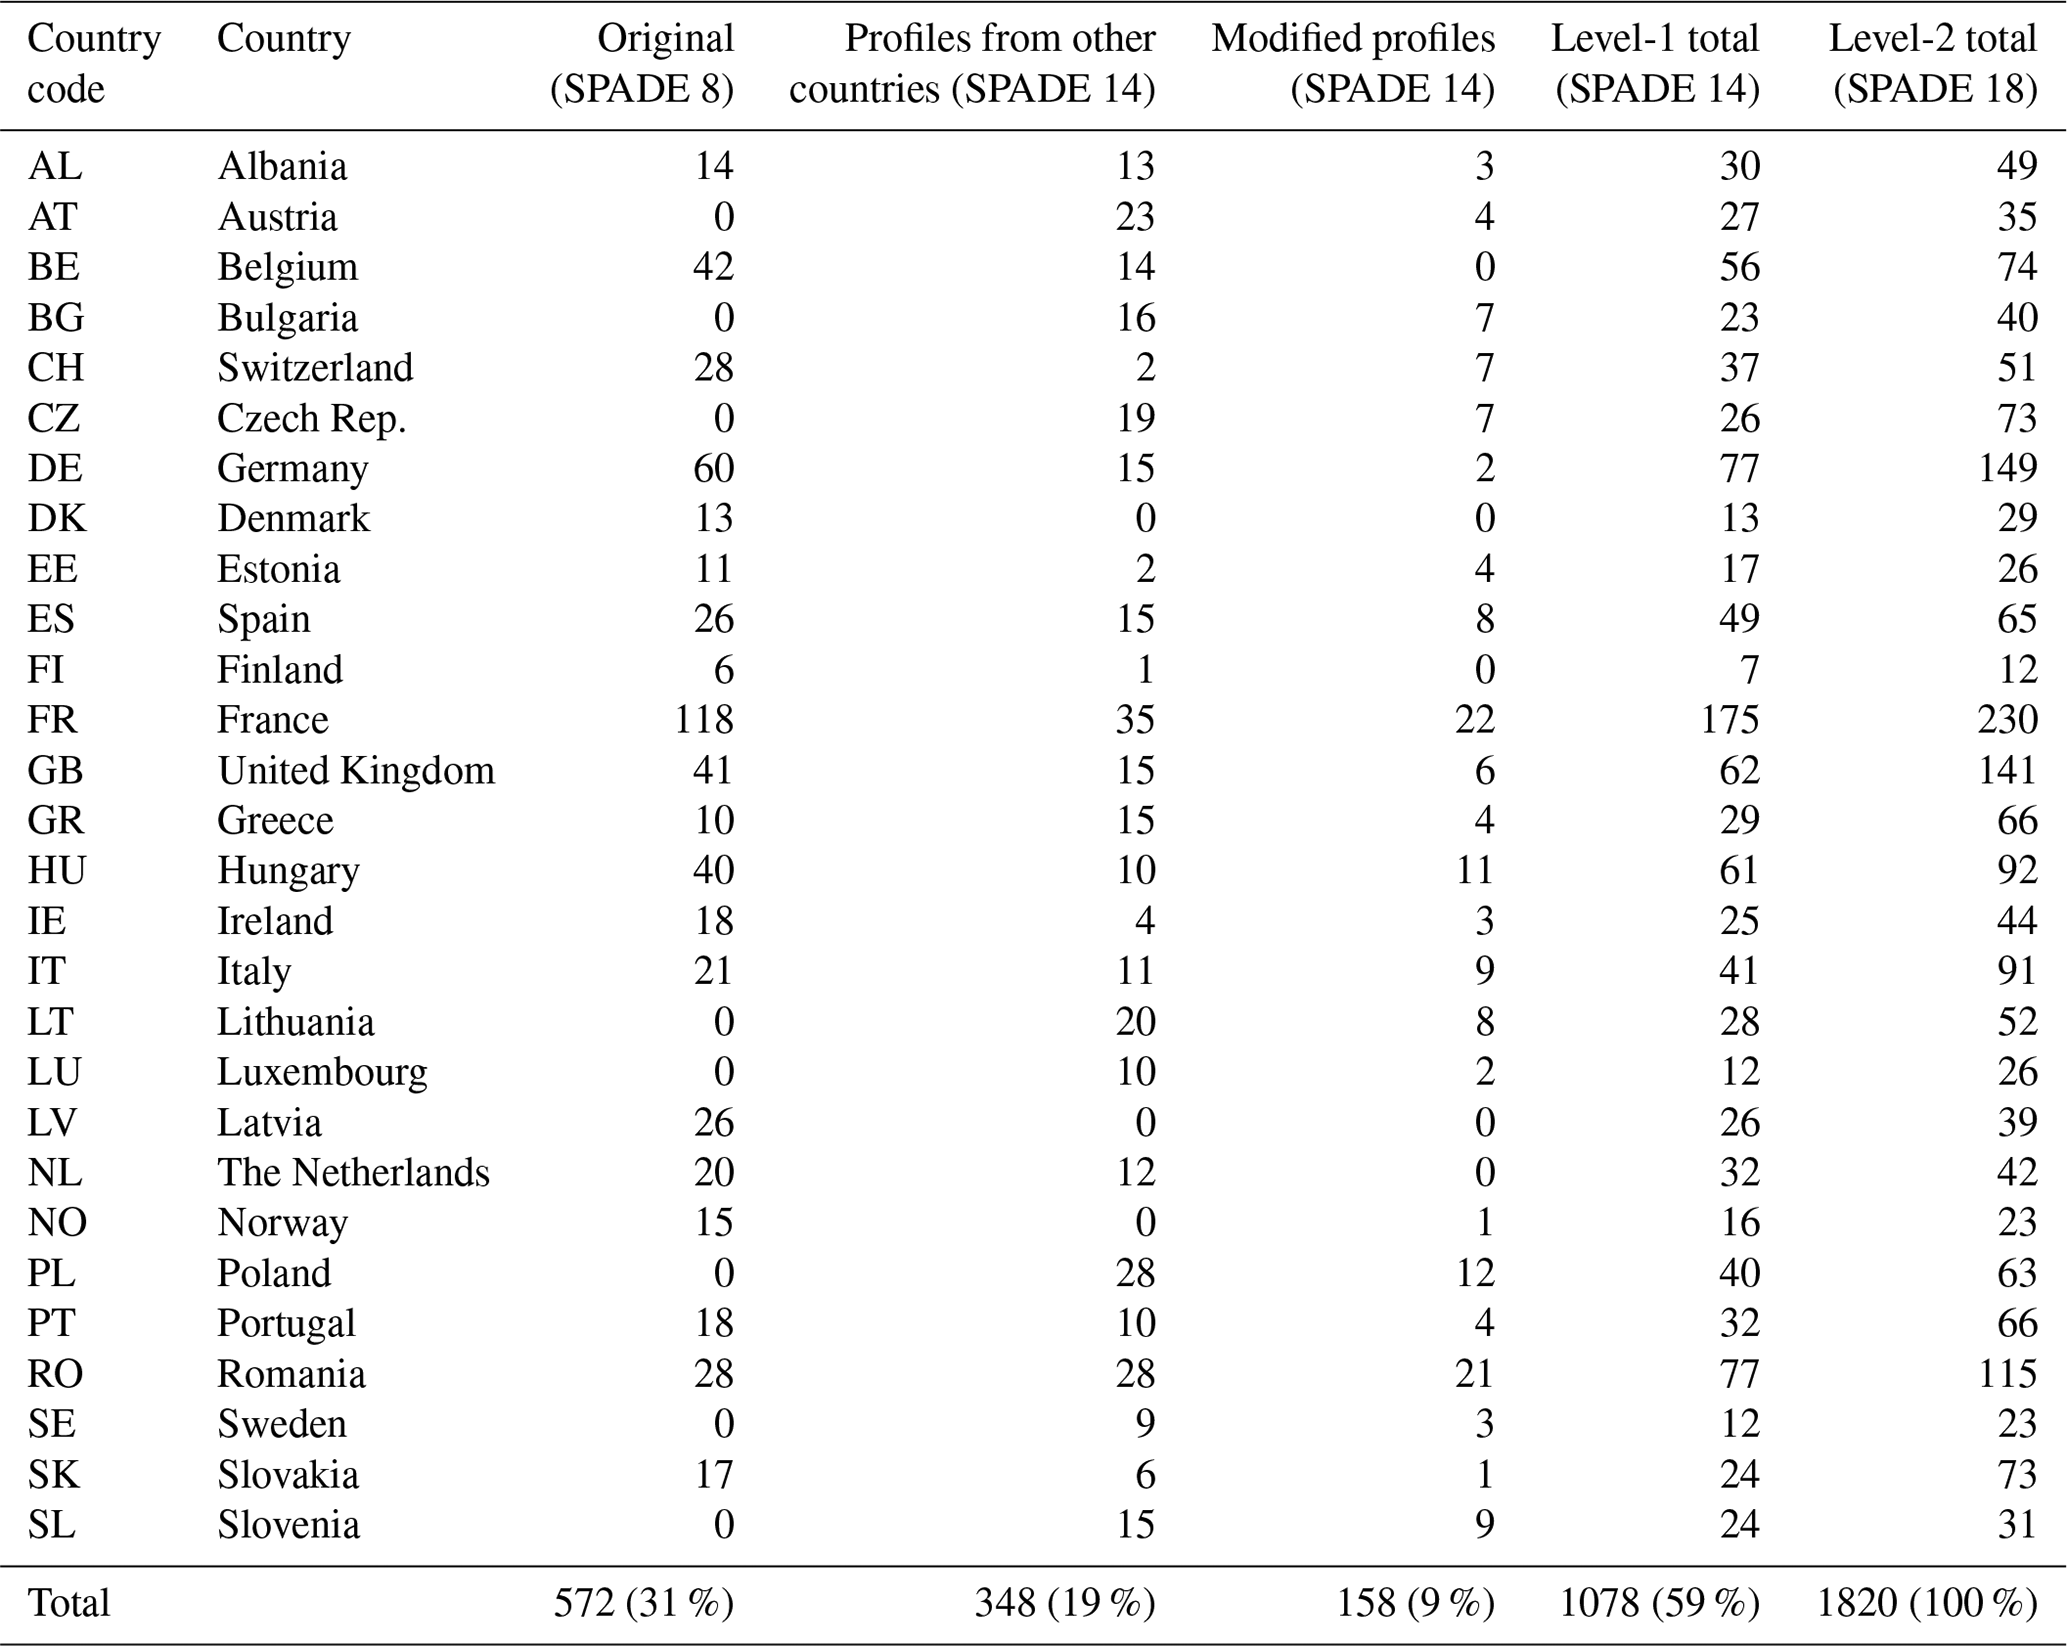
Overall, the SPADE 18 (level 2) database contains soil analytical data from 1820 profiles, which is about 40 % more than the number of profiles in SPADE 14 (level 1) containing soil analytical data from 1078 profiles, almost double the number of profiles available in SPADE 1 and 8. Most of the profiles originally lacking data had allocated datasets from complete profiles from other countries. Yet ∼15 % of the dominant profiles specified by soil type and texture were neither present in SPADE 1 nor 8 and had to be constructed by modifying other existing profile datasets to fit the required soil classification. Eight countries neither delivered data to SPADE 1 nor 8. Thus, datasets for these countries were exclusively based on imported or modified datasets. Stakeholders have been notified throughout this project that they may update their national datasets at any time by contacting the responsible ESDAC office.
As described previously, the SPADE framework has four levels. The level-2 database contains the same type of analytical data as the level-1 database, but in addition to the dominating soil types, the inclusions and associations have been assigned a set of estimated analytical data. This improves the use of the SGDBE to predict soil characteristics (e.g. irrigation need or carbon stocks), as users can assign values for all soil types within each SMU.
In 2017, a working group from the European Soil Bureau and University of Copenhagen discussed the methodology for creating a level-2 SPADE database (SPADE 18). Given that it took about 20 years to create the level-1 database, it was decided to speed up the process by following the route used to finalise SPADE 14 to have a complete dataset that could be subsequently improved by national stakeholders. The following concepts were developed based on the work on finalising level-2 datasets from two member states, Denmark and the UK.
-
For each country, unique combinations of all soil types and topsoil textures present as dominant, associated or included STUs were listed. For the UK 79 new soil types had to be added to the 62 at level 1, and for Denmark this left 29 unique combinations compared to 13 at level 1, where only dominant soil types were considered. Thus, 16 new soil types had to be added to the Danish database.
-
For each missing soil type, the entire level-1 database was scrutinised for the particular soil type. If multiple countries contained the soil type, profiles from neighbouring countries had preference. If more than one neighbouring country had the desired soil type, agricultural land use had preference, according to the original aim of MARS and SPADE (Breuning-Madsen, 1989; Vossen, 1993).
-
In cases where the soil type did not exist as a dominating soil type for any other country in the database, the soil types were taken from a database containing modified soil profile data. This database was created by compiling a list of all combinations of soil type and topsoil texture in the entire SPADE database that did not exist as dominating in any country and therefore had no estimated data assigned at level 1 (129 unique combinations in total). In the same way as described for the dominating soil types, data were estimated for these profiles by making minor modifications to existing profiles. For example, a Podzol with a topsoil texture class 2 (Po-2) could be created from a slight modification of the topsoil particle-size distribution for a Po-1 and a subsequent adjustment of other characteristics affected by the change in soil texture.
-
After completion, the level-2 database will be shared with national stakeholders for evaluation, and changes can be made to any data not found to be valid or meaningful.
-
The final version will be published through JRC's ESDAC website (http://esdac.jrc.ec.europa.eu/, last access: 1 October 2019).
Earlier versions of the SPADE have been used to estimate SOC stocks (European Commission, 2005). More recently, SPADE was used to map the distribution of wheel load-carrying capacity in Europe (Schjønning et al., 2015).
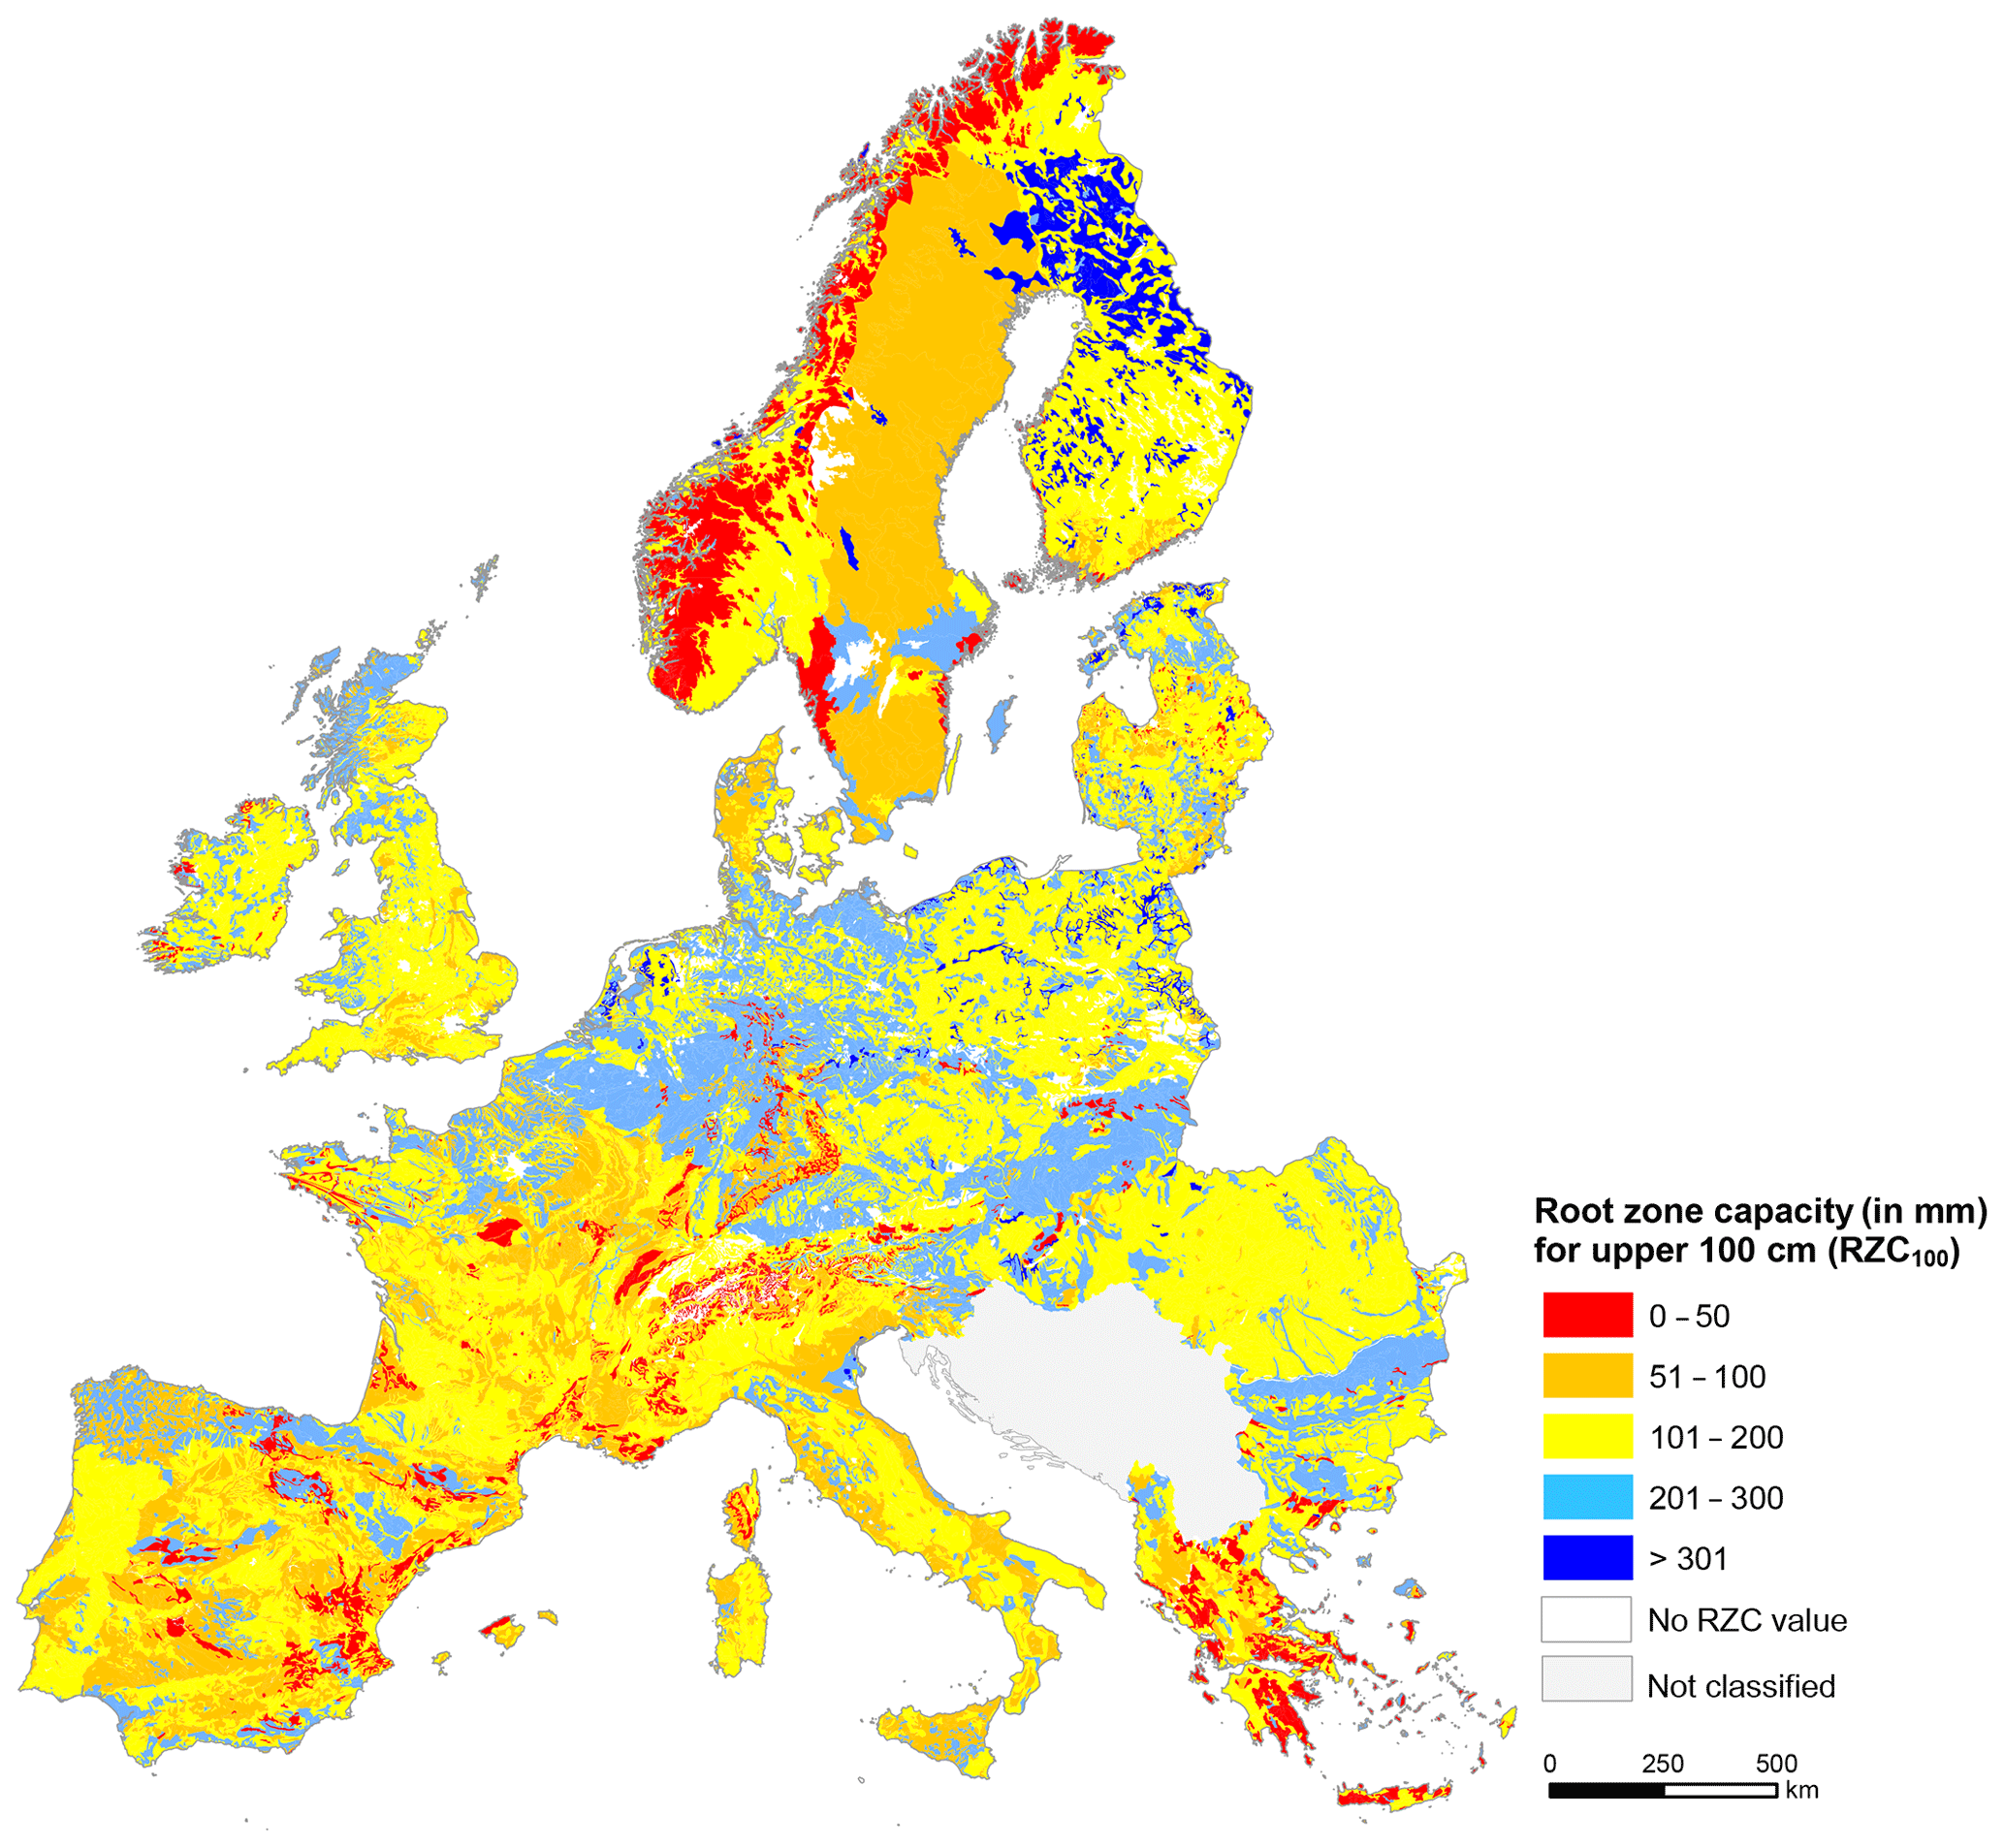
Figure 2Plant available water content (in mm) within the uppermost 1 m of the soil: very low – 0–50 mm, low – 50–100 mm, medium – 100–200 mm, high – 200–300 mm – and very high – >300.
7.1 Root zone capacity to 100 cm
As an example of the use of the complete SPADE level-1 database for a relevant soil property, we calculated the plant-available water for crops having an effective root depth of 100 cm (e.g. barley), also called root zone capacity (RZC100) (Fig. 2). Crop production on soils with RZC100<50 mm in northern Europe and <100 mm in southern Europe is highly dependent on irrigation. RZC was estimated from the following equation:
where RZC100 is the cumulated root zone capacity (mm) within the upper 100 cm, VWC1500i is the volumetric water content at −1500 kPa for horizon i (%), VWC10i is the volumetric water content at −10 kPa for horizon i (%) and Di is the depth of horizon i (mm).
Areas with very high RZC100 (>300 mm) relate mainly to the occurrence of Histosols, Gleysols and Fluvisols, which are affected by shallow groundwater tables and few well-drained soils with high silt and fine sand content (Fig. 2). Soils with high RZC100 (200–300 mm) are common in the loess belt, just south of the ice margin from the previous ice ages, e.g. Belgium and Germany. The medium RZC100, 100–200 mm, corresponds mainly to loamy soils, for instance, those dominating in eastern Denmark, England and Poland, while sandy soils and some shallow loamy soils have a low RZC100 of 50–100 mm, e.g. western Denmark and Sweden. Very shallow soils (Leptosols) have a very low RZC100 of 0–50 mm, which are found primarily in mountainous regions such as the Alps, coastal Norway and large parts of Greece.
7.2 SOC stock to 100 cm for Europe
We estimated the SOC stock for Europe from the following equation:
where SOC100 is the cumulated SOC stock to 100 cm depth, gi is the gravimetric coarse-particle fraction (>2 mm) of horizon i (coarse material correction; Hobley et al., 2018), pi is the fine-earth (<2 mm) bulk density of horizon i, SOCi is the SOC concentration for horizon i, Di is the depth of horizon i and A is the area of the particular STU, i.e. the area of the SMU multiplied by the proportional area covered by the STU (Fig. 3). The regional distribution of soil organic C stocks is similar to what was found previously (European Environment Agency, 2012; Panagos et al., 2013). The highest stocks are concentrated in areas dominated by Histosols (e.g. northwestern British Isles and Finland; Fig. 3). Intermediate stocks are situated in the wet northwestern Iberian Peninsula, in the Massif Central region in France and in the interior parts of the Scandinavian Peninsula, while soils with relatively low SOC stocks are situated in mountainous areas (e.g. coastal Norway), dry Mediterranean areas and areas under intensive cultivation (e.g. northern France, Germany and Denmark).
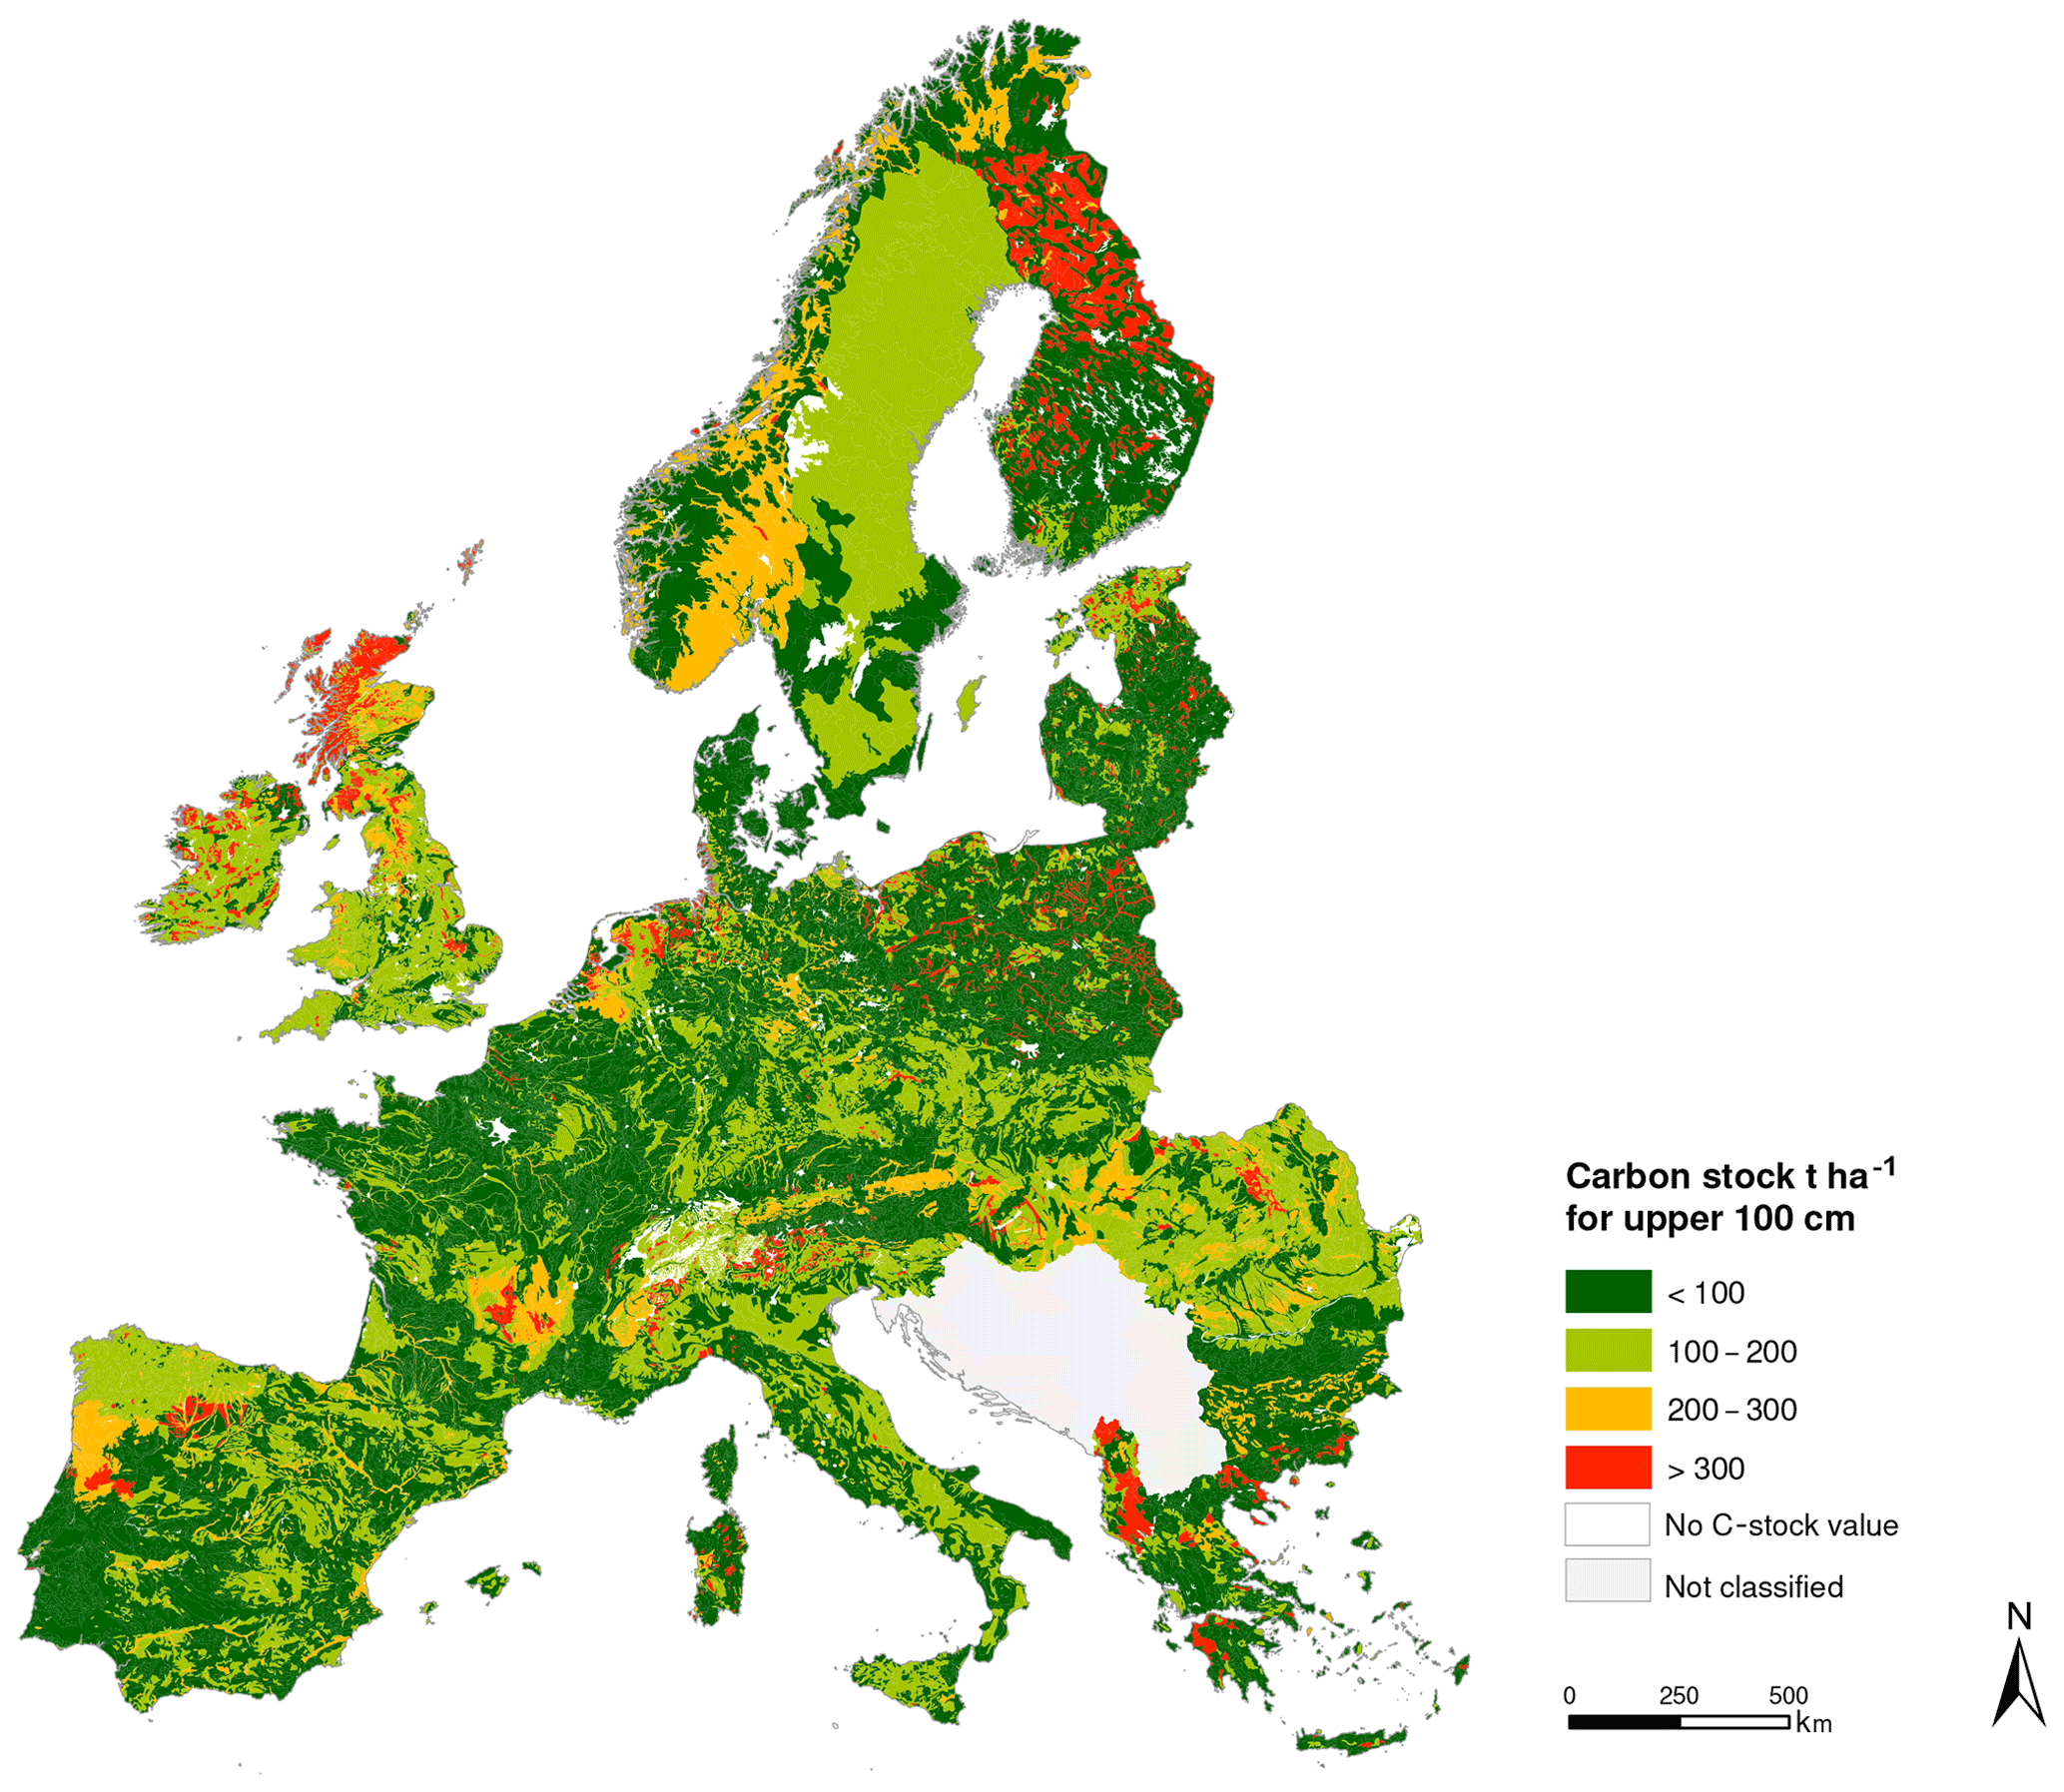
Figure 3The soil organic carbon stocks (t ha−1) in Europe within the upper 100 cm of soil calculated based on level-1 data (dominating soil types only).
Our estimated cumulated SOC stock for Europe (0–100 cm) based on SPADE 14 (level 1) is 60×1015 g. This compares to the estimate of 75×1015 g obtained by the European Environment Agency (2012) and the EC Joint Research Centre (Panagos et al., 2013) based on an earlier version of the database, showing that our approach produces a somewhat lower result. We did not find other estimates of European SOC stocks across landscape types in the scientific literature. However, as an approximation we may sum up the recent estimates of SOC stocks in agricultural and forest soils. The forest SOC stock in Europe (0–100 cm) was estimated to be 22×1015 g (De Vos et al., 2015), while the agricultural SOC stock (0–30 cm) was estimated to 18×1015 g (Lugato et al., 2014). As an attempt to roughly correct for the agricultural estimate only covering the upper 30 cm of the soil profile, we assumed that the topsoil (0–30 cm) contained about 60 % of the SOC stock in the top 100 cm (De Vos et al., 2015). Using this correction the estimate for the agricultural soils to 100 cm increased to 30×1015 g, so the estimates sum up to 52×1015 g SOC, which is quite similar to our SPADE 14 (level 1) estimate. Particularly considering that over- or underestimation of ∼40–100 % when comparing to other studies is common (De Vos et al., 2015; Guevara et al., 2018; Lugato et al., 2014). Nonetheless, work still remains on elucidating the underlying sources of variation to find the best approach, as estimates of SOC are considered to be an important indicator of environmental health (European Environment Agency, 2012; Panagos et al., 2013).
7.3 Better estimates with SPADE level 2: the SOC stock in Denmark
The application of SPADE level-2 (SPADE 18) data has been tested in a pilot study calculating the RZC for wheat in Denmark (Jensen et al., 1998). They found a substantial difference of up to ∼50 % in estimated national RZC values when comparing level-1 to level-2 data. To show the added value from including the associations and inclusions in another example, we calculated the SOC to 1 m depth for Denmark based on SPADE 14 (level 1; Fig. 4a) and SPADE 18 (level 2; Fig. 4b) data.
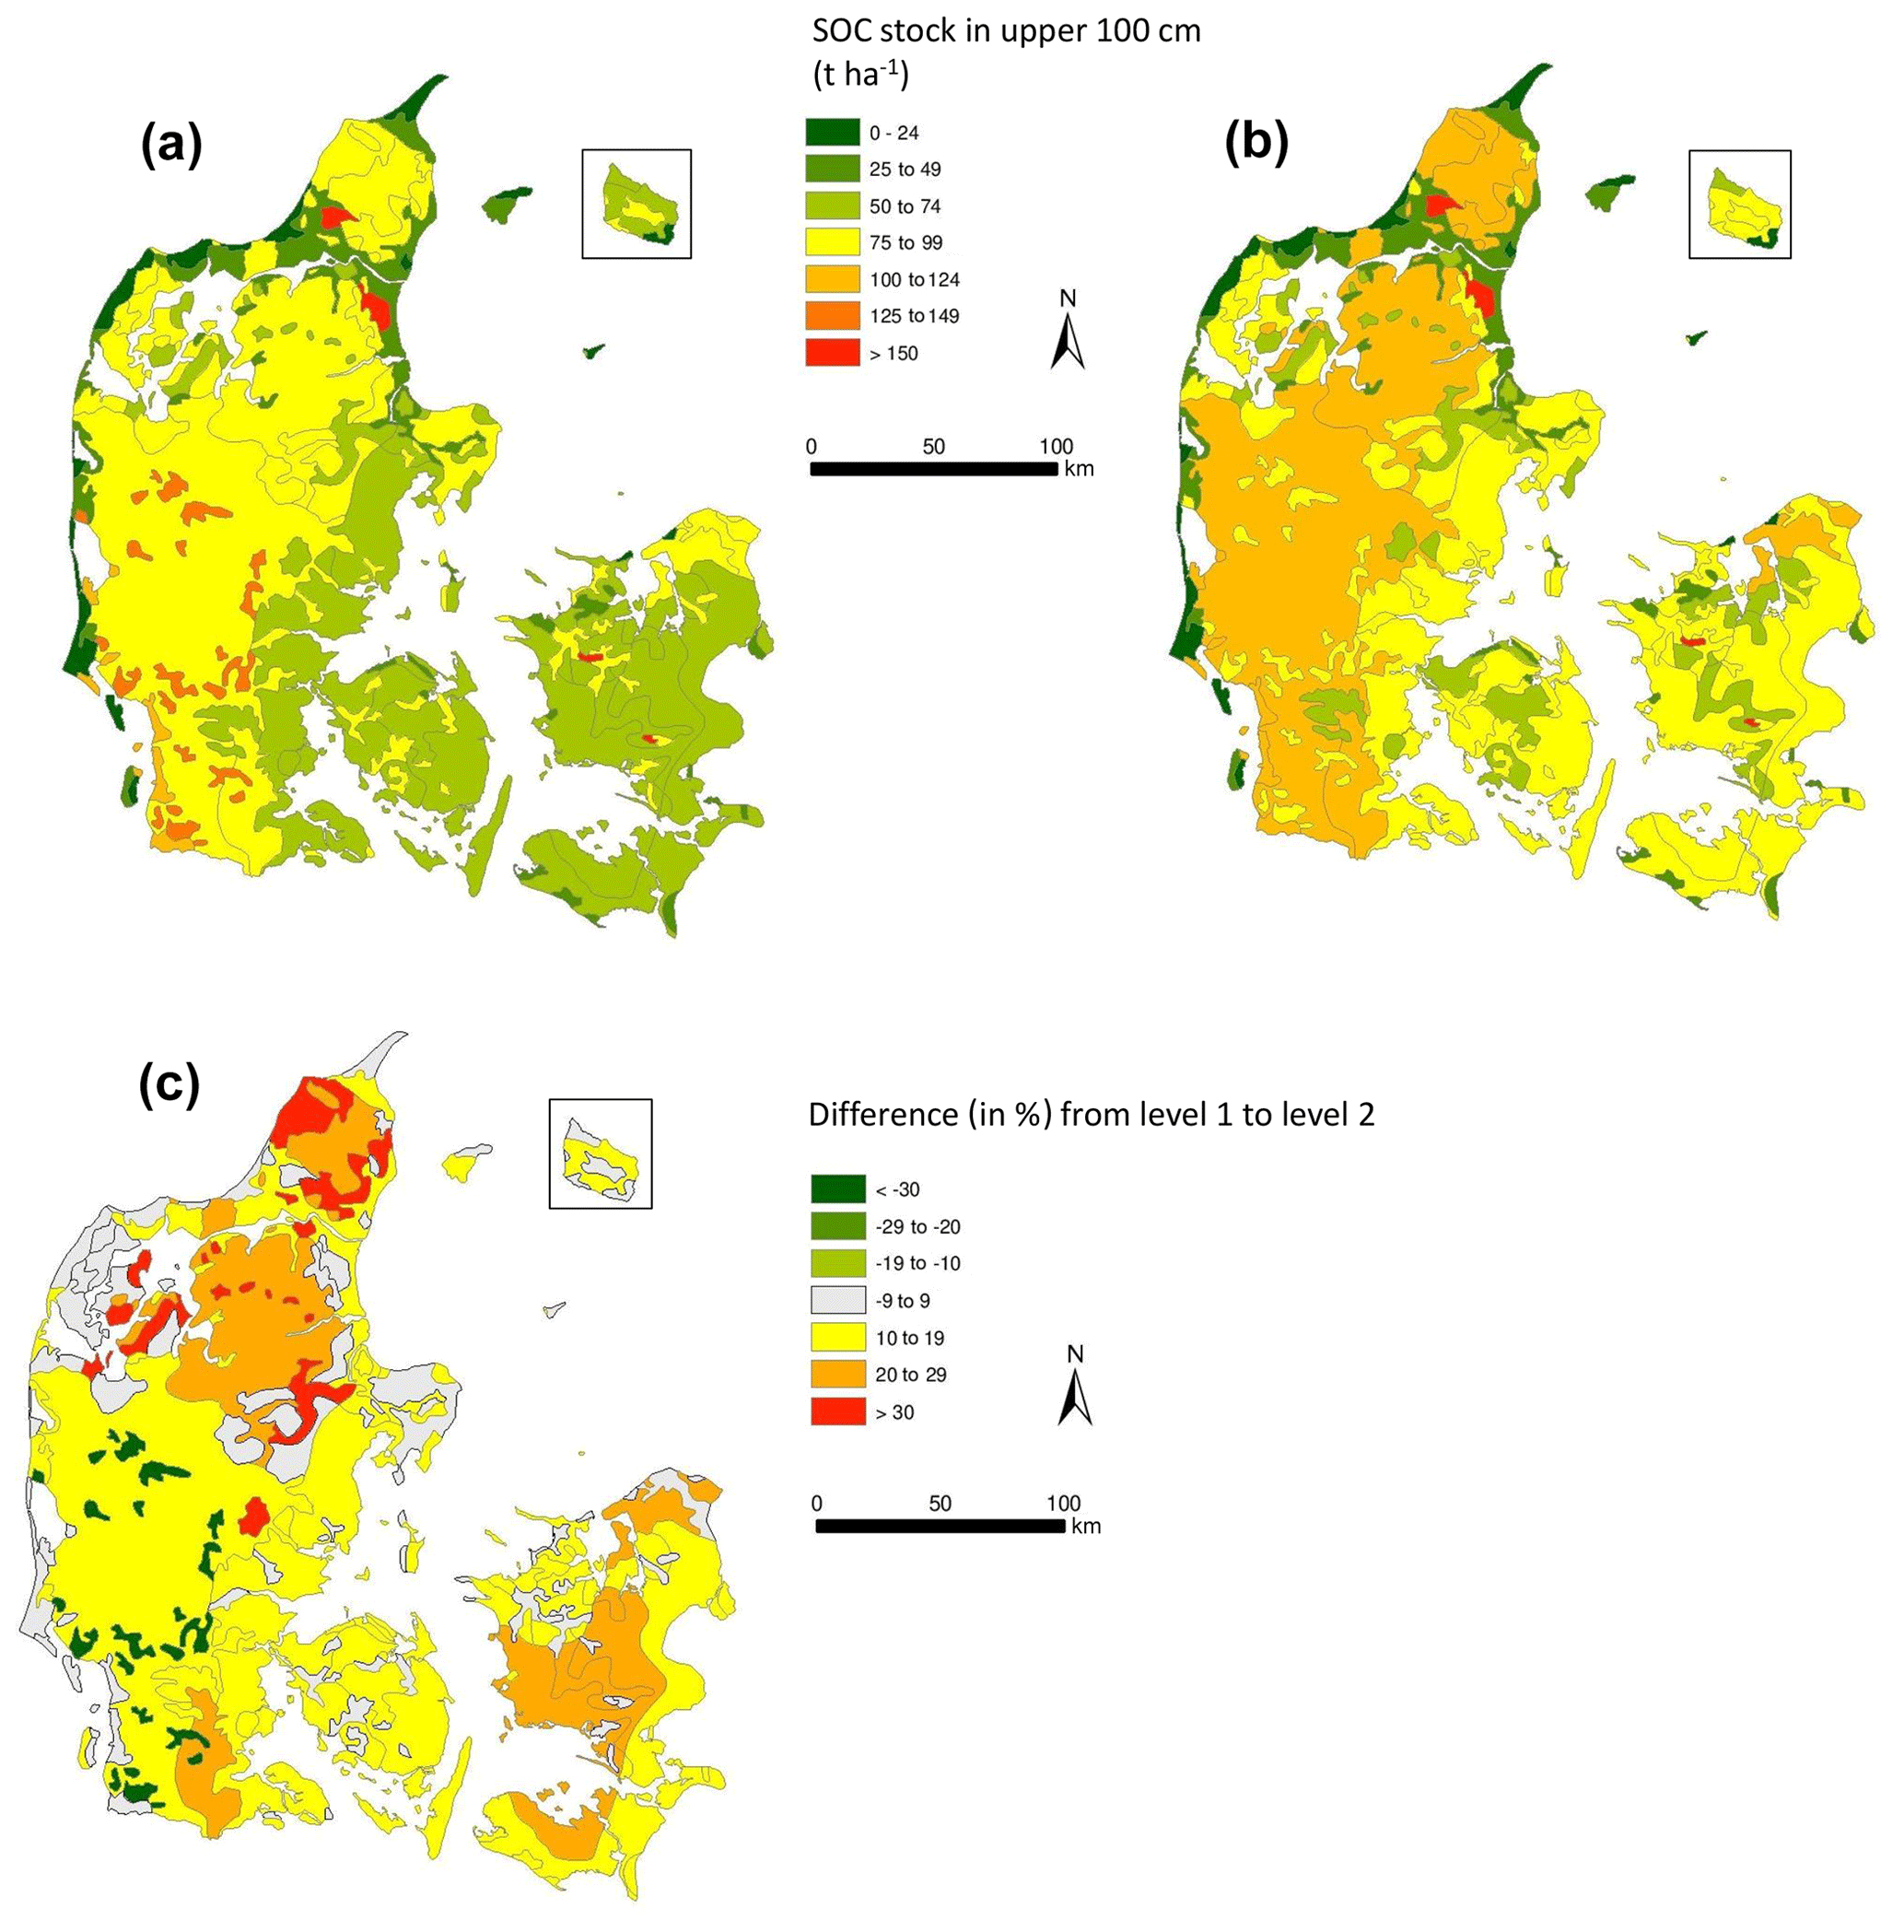
Figure 4Soil organic carbon stocks (t ha−1) in Denmark within the upper 100 cm of the soil calculated based on (a) SPADE 14 level-1 data and (b) SPADE 18 level-2 data. (c) Shows the relative change from level 1 to level 2 (in %).
Overall, the comparison shows that the estimated total SOC stock in the upper metre of Danish soils increases by 12 % from 332×1012 to 378×1012 g C when using level-2 data instead of level-1 data. This number is higher, yet it is not quite as high as the most recent estimate obtained from digital soil mapping of about 570×1012 g C (Adhikari et al., 2014) and previous estimates ranging from 563 to 598×1012 C (Krogh et al., 2003), but it suggests that using level-2 data yields more comparable results than using level-1 data. The increase in SOC stock using level-2 data compared to level-1 data is mostly due to SOC-rich soils such as Histosols, Gleysols and Fluvisols, which are primarily present as associations or inclusions. The spatial distribution of the changes reveals that particularly in northern Jutland on the raised seabeds, the inclusion of subordinate soil types increased the SOC stock substantially (Fig. 4c), occasionally by more than 30 % (red areas). For sandy soils (western Jutland), the carbon gain was modest, typically less than 20 %. Only in small loamy SMUs in western Jutland did the carbon content decrease by using the level-2 database, which is probably due to the inclusion of sandy soils with relatively low organic matter content. This study highlights the added accuracy of estimating an environmentally relevant soil property like SOC stock by the more detailed level-2 database, which yielded estimates more similar to the estimates obtained with pedometric (Krogh et al., 2003) and advanced interpolation approaches (Adhikari et al., 2014) than results based on SPADE level 1.
Digital soil mapping (DSM; reviewed in Mulder et al., 2011; Minasny and McBratney, 2016; Zhang et al., 2017) is the future of soil mapping and is constantly developing and improving (e.g. Hengl et al., 2017; Møller et al., 2019; Pouladi et al., 2019; Stockmann et al., 2015; Zeraatpisheh et al., 2019). The great advantage of these formalised approaches is their reproducibility and ability to estimate the accuracy of their predictions. However, as mentioned earlier, challenges to such inference techniques persist (Mulder et al., 2011; Zhang et al., 2017); particularly data scarcity is a major challenge. Similar conclusions underlie data harmonisation initiatives at the global scale led by ISRIC, which has led to the construction of the GlobalSoilMap (Arrouays et al., 2014), the SoilGrids (Hengl et al., 2014, 2017), the HWSD (Nachtergaele et al., 2014) and the WISE30sec (Batjes, 2016). To overcome this, the EU recently launched the LUCAS 2018 – SOIL COMPONENT (Fernández-Ugalde et al., 2017), which is a soil-sampling programme that will provide measured soil data from ∼27 000 profiles covering the European area.
However, to supplement such approaches until data availability increases, databases with analytical soil properties estimated or evaluated by local expert stakeholders are still a feasible way of assessing large-scale soil property patterns, which are substantiated by our ability to estimate similar distributions and stocks as previous studies. Yet our voluntary approach is vulnerable to inadequate stakeholder engagement, which has been a challenge throughout this process. This adds to the justifications of the LUCAS 2018 – SOIL COMPONENT.
A consideration with respect to the interpretation of outputs from bottom-up harmonised databases, like SPADE, is how well the mapping units actually reflect real soil and landscape delineations (Fig. 1a). Efforts have been made by the ESDAC to let mapping units overlap arbitrary administrative limits, such as national borders, to best fit the SMU delineations on both sides (e.g. European Commission, 2005). However, the inherent variation in the level of detail from the national datasets is still evident in certain areas (see for instance the Danish–German border in maps – European Commission, 2005). Therefore, the predictions based on the current dataset might be improved by modern downscaling techniques (see Møller et al., 2019, for an example), but it might be appropriate to consider a cell-based data representation if further disaggregation were to be implemented. However, considering the scale of the EU soil map (1:1 000 000), it is not feasible to delineate single STUs, so working with SMUs with a set of STUs is still feasible for this purpose.
We document the development of a full-covered EU-wide soil database, containing analytical data connected to the soil map of Europe at a scale of 1:1 000 000. We show the benefits of careful analysis of legacy data, wherever possible, with the help of national soil experts.
The application of the current soil analytical database at level 1 was illustrated by calculating the root zone capacity to 100 cm for the Europe and associated countries, mapping out areas where severe need of irrigation for crop production might occur. Moreover, we estimate the SOC stock at 100 cm for Europe to be 60×1015 g, which is comparable to previous estimates. The increased accuracy obtained by including associated and included soil types in the SPADE database was presented by comparing the SOC stock of Denmark calculated from level-1 and level-2 data, showing an increase of 12 % from 332×1012 to 378×1012 g C, which is closer to literature estimates obtained with other methods. This exercise highlights the need for a level-2 database for the entire European area.
Perhaps the greatest contribution of this research to the management and protection of Europe's soils is the harmonisation of detailed soil profile data, hitherto unavailable across regions but now connected to the latest soil mapping. These considerations are driving initiatives such as the soil component of the LUCAS survey, which by generating harmonised and comparable data on topsoil characteristics across the EU (Orgiazzi et al., 2014), increases the predictive capability and accuracy of digital soil-mapping approaches. In time, soil mapping will need to accommodate high data streams that will be driven by precision farming, proximal sensing and the internet of things (Carolan, 2017), but until sufficient data amounts exist, databases with expert estimated data like the current SPADE are a good supplement.
Finally, while soils are often on land under private ownership, there is the increasing recognition of soil as a “public good” that provides society with key ecosystem services. In such a paradigm, there is a strong case to be made for providing unrestricted access to soil data. Many national soil institutions regard soil profiles as “primary data sources” that underpin revenue earning systems. However, there is a strong case for inherent soil data (i.e. texture, carbon, pH, nutrient content, cation exchange capacity, EC, etc.) that reflect pedogenic processes and basic land management practices to be publicly available (with appropriate attribution or data-sharing licence). Such an approach, possibly driven by the aims of the Global Soil Partnership to enhance the quantity and quality of soil data and data collection, could lead to a more rapid completion of the higher-level orders of SPADE while at the same time providing new understanding in pedogenesis and the need for further research.
The data are available at the ESDAC website: https://esdac.jrc.ec.europa.eu/content/spade-14 (last access: 2 October 2019).
JAK and HBM framed the work and led the paper writing. HBM and JAK scrutinised and updated the databases. TB did the GIS analyses and created the maps. RJAJ, AJ, LM and PP made substantial contributions during revisions.
The authors declare that they have no conflict of interest.
We want to warmly thank our late colleague and friend, Professor Henrik Breuning-Madsen, who passed away during the preparation of this paper. He was a key figure in moving European soil science forward over more than three decades. We thank all national stakeholders for their contributions to the development of the SPADE database. For a full list of stakeholders, we refer to ESDAC's home page: http://esdac.jrc.ec.europa.eu/ (last access: 1 October 2019).
This research has been supported by the EC Joint Research Centre.
This paper was edited by Bas van Wesemael and reviewed by two anonymous referees.
Adhikari, K., Hartemink, A. E., Minasny, B., Bou Kheir, R., Greve, M. B., and Greve, M. H.: Digital Mapping of Soil Organic Carbon Contents and Stocks in Denmark, PLoS ONE, 9, e105519, https://doi.org/10.1371/journal.pone.0105519, 2014.
Arrouays, D., Grundy, M. G., Hartemink, A. E., Hempel, J. W., Heuvelink, G. B. M., Hong, S. Y., Lagacherie, P., Lelyk, G., McBratney, A. B., McKenzie, N. J., Mendonca-Santos, M. d. L., Minasny, B., Montanarella, L., Odeh, I. O. A., Sanchez, P. A., Thompson, J. A., and Zhang, G.-L.: GlobalSoilMap: Toward a Fine-Resolution Global Grid of Soil Properties, Chp. 3, in: Advances in Agronomy, edited by: Sparks, D. L., Academic Press, 125, 93–134, 2014.
Batjes, N.: Harmonized soil property values for broad-scale modelling (WISE30sec) with estimates of global soil carbon stocks, Geoderma, 269, 61–68, https://doi.org/10.1016/j.geoderma.2016.01.034, 2016.
Breuning-Madsen, H.: Elaboration of a soil profile and analytical database connected to the EC soil map: 119 132, in: Application of computerized EC soil map and climate data, edited by: van Lanen, H. A. J. and Bregt, A. K., Proceedings of a workshop in the community programme for coordination of agricultural research, 15–16 November 1988, Wageningen, Report EUR 12039 EN, Luxembourg, pp. 254, 1989.
Breuning-Madsen, H. and Jones, R. J. A.: Soil profile Analytical database for the European Union, Danish Journal of Geography, 95, 49–57, https://doi.org/10.1080/00167223.1995.10649363, 1995.
Breuning-Madsen, H., Kristensen, J. A., and Balstrøm, T.: Final report on the establishment of a SPADE 14 soil profile analytical database connected to the EU soil map at scale 1:1.000.000, Report to JRC Ispra, Italy, available at: https://esdac.jrc.ec.europa.eu/public_path/shared_folder/dataset/53/Final_report_230815_SPADE14.pdf (last access: 2 October 2019), 2015.
Briggs, D. J. and Martin, D. M.: CORINE: An environmental information system for the European Community, Environ. Rev., 2, 29–34, 1988.
Carolan, M.: Publicising Food: Big Data, Precision Agriculture, and Co-Experimental Techniques of Addition, Sociologia Ruralis, 57, 135–154, https://doi.org/10.1111/soru.12120, 2017.
Commission of the European Communities: Soil map of the European Communities, scale 1:1 M, Directorate General for Agriculture. Office for Official Publications of the European Communities, Luxembourg, 1985.
De Vos, B., Cools, N., Ilvesniemi, H., Vesterdal, L., Vanguelova, E., and Carnicelli, S.: Benchmark values for forest soil carbon stocks in Europe: Results from a large scale forest soil survey, Geoderma, 251–252, 33–46, https://doi.org/10.1016/j.geoderma.2015.03.008, 2015.
European Commission: Soil Atlas of Europe, European Soil Bureau Network, The European Commission 2005, Office of the official publications of the European Communities, Luxemburg, 128 pp., 2005.
European Environment Agency: Soil organic carbon, Indicator assessment, European Environment Agency, Copenhagen, Denmark, 2012.
FAO: Status of the World's soil resources, FAO, Rome, Italy, 2015.
FAO/IIASA/ISRIC/ISSCAS/JRC: Harmonized World Soil Database (version 1.2), FAO, Rome, Italy and IIASA, Laxenburg, Austria, 2012.
FAO-Unesco: Soil map of the world, vol. 1, Legend, Unesco, Paris, 1974.
Fernández-Ugalde O., Orgiazzi, A., Jones, A., Lugato, E., and Panagos, P.: LUCAS 2018 – SOIL COMPONENT: Sampling Instructions for Surveyors, ISBN 978-92-79-66255-3, ISSN 1831-9424, doi:10.2760/023673, Scientific and Technical Research Report JRC105923, Publications Office of the European Union, 2017.
Folberth, C., Skalský, R., Moltchanova, E., Balkovič, J., Azevedo, L. B., Obersteiner, M., and van der Velde, M.: Uncertainty in soil data can outweigh climate impact signals in global crop yield simulations, Nat. Commun., 7, 11872, https://doi.org/10.1038/ncomms11872, 2016.
Guevara, M., Olmedo, G. F., Stell, E., Yigini, Y., Aguilar Duarte, Y., Arellano Hernández, C., Arévalo, G. E., Arroyo-Cruz, C. E., Bolivar, A., Bunning, S., Bustamante Cañas, N., Cruz-Gaistardo, C. O., Davila, F., Dell Acqua, M., Encina, A., Figueredo Tacona, H., Fontes, F., Hernández Herrera, J. A., Ibelles Navarro, A. R., Loayza, V., Manueles, A. M., Mendoza Jara, F., Olivera, C., Osorio Hermosilla, R., Pereira, G., Prieto, P., Ramos, I. A., Rey Brina, J. C., Rivera, R., Rodríguez-Rodríguez, J., Roopnarine, R., Rosales Ibarra, A., Rosales Riveiro, K. A., Schulz, G. A., Spence, A., Vasques, G. M., Vargas, R. R., and Vargas, R.: No silver bullet for digital soil mapping: country-specific soil organic carbon estimates across Latin America, SOIL, 4, 173–193, https://doi.org/10.5194/soil-4-173-2018, 2018.
Hannam, J. A., Hollis, J. M., Jones, R. J. A., Bellamy, P. H., Hayes, S. E., Holden, A. M., van Liedekerke, M. H., and Montanarella, L.: SPADE-2: Soil Profile Analytical Database for Europe Version 2.0 Beta Version March 2009, available at: https://esdac.jrc.ec.europa.eu/Esdb_Archive/eusoils_docs/esb_rr/SPADE-2_Beta_Report.pdf (last access: 1 October 2019), 27 pp., 2009.
Hengl, T., de Jesus, J. M., MacMillan, R. A., Batjes, N. H., Heuvelink, G. B. M., Ribeiro, E., Samuel-Rosa, A., Kempen, B., Leenaars, J. G. B., Walsh, M. G., and Gonzalez, M. R.: SoilGrids1km – Global Soil Information Based on Automated Mapping, PLoS ONE, 9, e105992, https://doi.org/10.1371/journal.pone.0105992, 2014.
Hengl, T., de Jesus, J. M., Heuvelink, G. B. M., Gonzalez, M. R., Kilibarda, M., Blagotić, A., Shangguan, W., Wright, M. N., Geng, X., Bauer-Marschallinger, B., Guevara, M. A., Vargas, R., MacMillan, R. A., Batjes, N. H., Leenaars, J. G. B., Ribeiro, E., Wheeler, I., Mantel, S., and Kempen, B.: SoilGrids250m: Global gridded soil information based on machine learning, PLoS ONE, 12, e0169748, https://doi.org/10.1371/journal.pone.0169748, 2017.
Hobley, E. U., Murphy, B., and Simmons, A.: Comment on “Soil organic stocks are systematically overestimated by misuse of the parameters bulk density and rock fragment content” by Poeplau et al. (2017), SOIL, 4, 169–171, https://doi.org/10.5194/soil-4-169-2018, 2018.
Hollis, J. M., Jones, R. J. A., Marshall, C. J., Holden, A., Renger van de Veen, J., and Montanarella, L.: SPADE-2: The Soil Profile Analytical Database for Europe (version 1.0), EUR 22127 EN, 2006.
Jensen, N. H., Balstrøm, T., and Breuning-Madsen, H.: Root zone capacity maps for Denmark based on the EU soil profile analytical database: 421–434, in: Land information systems – Developments for planning the sustainable use of land resources, edited by: Heineke, H. J., Eckelmann, W., Thomasson, A. J., Jones, R. J. A., Montanarella, L., and Buckley, B., European Soil Bureau Report 4, Ispra, Italy, EUR 17729 EN, pp. 546, 1998.
Jones, R. J. A., Spoor, G., and Thomasson, A. J.: Vulnerability of soils in Europe to Compaction: A preliminary analysis, Soil Till. Res., 73, 131–143, https://doi.org/10.1016/S0167-1987(03)00106-5, 2003.
Jones, R. J., Hiederer, R., Rusco, E., and Montanarella, L.: Estimating organic carbon in the soils of Europe for policy support, Eur. J. Soil Sci., 56, 655–671, https://doi.org/10.1111/j.1365-2389.2005.00728.x, 2005.
King, D., Daroussin, J., and Tavernier, R.: Development of a soil geographical database from the soil map of the European Communities, Catena, 21, 37–46, https://doi.org/10.1016/0341-8162(94)90030-2, 1994.
Kirkby, M. J., Irvine, B. J., Jones, R. J. A., and Govers, G.: The PESERA Team: The PESERA coarse scale erosion model for Europe. I. – Model rationale and implementation, Eur. J. Soil Sci., 59, 1293–1306, https://doi.org/10.1111/j.1365-2389.2008.01072.x, 2008.
Koue, P. M., Balstrøm, T., and Breuning-Madsen, H.: Update of the European Soil analytical database (SPADE-1) to version SPADE-8. Report to the European Soil Bureau, EC Joint Research Centre, Ispra, Italy, 2008.
Krogh, L., Noergaard, A., Hermansen, M., Greve, M. H., Balstroem, T., and Breuning-Madsen, H.: Preliminary estimates of contemporary soil organic carbon stocks in Denmark using multiple datasets and four scaling-up methods, Agr. Ecosyst. Environ., 96, 19–28, https://doi.org/10.1016/S0167-8809(03)00016-1, 2003.
Lambert, J. J., Daroussin, J., Eimberck,, M., Le Bas, C., Jamagne, M., King, D., and Montanarella, L.: Soil Geographical Database for Eurasia & The Mediterranean: Instructions Guide for Elaboration at scale , Version 4.0, EUR 20422 EN, 64 pp., Office for Official Publications of the European Communities, Luxembourg, 2003.
Lugato, E., Panagos, P., Bampa, F., Jones, A., and Montanarella, L.: A new baseline of organic carbon stock in European agricultural soils using a modelling approach, Global Change Biol., 20, 313–326, https://doi.org/10.1111/gcb.12292, 2014.
McBratney, A. B., Mendonça Santos, M. L., and Minasny, B.: On digital soil mapping, Geoderma, 117, 3–52, https://doi.org/10.1016/S0016-7061(03)00223-4, 2003.
Minasny, B. and McBratney, A. B.: Digital soil mapping: A brief history and some lessons, Geoderma, 264, 301–311, https://doi.org/10.1016/j.geoderma.2015.07.017, 2016.
Møller, A. B., Malone, B., Odgers, N. P., Beucher, A., Iversen, B. V., Greve, M. H., and Minasny, B.: Improved disaggregation of conventional soil maps, Geoderma, 341, 148–160, https://doi.org/10.1016/j.geoderma.2019.01.038, 2019.
Morvan, X., Saby, N. P. A., Arrouays, D., Le Bas, C., Jones, R. J. A., Verheijen, F. G. A., Bellamy, P. H., Stephens, M., and Kibblewhite, M. G.: Soil monitoring in Europe: a review of existing systems and requirements for harmonisation, Sci. Total Environ., 391, 1–12, https://doi.org/10.1016/j.scitotenv.2007.10.046, 2008.
Mulder, V. L., de Bruin, S., Schaepman, M. E., and Mayr, T. R.: The use of remote sensing in soil and terrain mapping – A review, Geoderma, 162, 1–19, https://doi.org/10.1016/j.geoderma.2010.12.018, 2011.
Nachtergaele, F. O., van Velthuizen, H., Wiberg, D., Batjes, N. H., Dijkshoorn, J. A., van Engelen, V. W. P., Fischer, G., Jones, A., Montanarela, L., Petri, M., Prieler, S., Teixeira, E., and Shi, X.: Harmonized World Soil Database (version 1.0), Dataset, ISRIC – World Soil Information, Wageningen, the Netherlands, 2014.
Orgiazzi, A., Ballabio, C., Panagos, P., Jones, A., and Fernández-Ugalde, O.: LUCAS Soil, the largest expandable soil dataset for Europe: a review, Eur. J. Soil Sci., 69, 140–153, https://doi.org/10.1111/ejss.12499, 2018.
Panagos, P., Van Liedekerke, M., Jones, A., and Montanarella, L.: European Soil Data Centre: Response to European policy support and public data requirements, Land Use Policy, 29, 329–338, https://doi.org/10.1016/j.landusepol.2011.07.003, 2012.
Panagos, P., Hiederer, R., Van Liedekerke, M., and Bampa, F.: Estimating soil organic carbon in Europe based on data collected through an European network, Ecological Indicators, 24, 439–450, https://doi.org/10.1016/j.ecolind.2012.07.020, 2013.
Panagos, P., Borrelli, P., Poesen, J., Ballabio, C., Lugato, E., Meusburger, K., Montanarella, L., and Alewell, C.: The new assessment of soil loss by water erosion in Europe, Environmental Science Policy, 54, 438–447, https://doi.org/10.1016/j.envsci.2015.08.012, 2015.
Platou, S. W., Nørr, A. H., and Breuning-Madsen, H.: Digitisation of the EC soil map: 12 24, in: Computerization of land use data, edited by: Jones, R. J. A. and Biagi, B., Proceedings of a symposium in the community programme for coordination of agricultural research, 20–22 May 1987, Pisa, Report EUR 11151, Luxembourg, pp. 155, 1989.
Pouladi, N., Møller, A. B., Tabatabai, S., and Greve, M. H.: Mapping soil organic matter contents at field level with Cubist, Random Forest and kriging, Geoderma, 342, 85–92, https://doi.org/10.1016/j.geoderma.2019.02.019, 2019.
Robinson, D. A., Panagos, P., Borrelli, P., Jones, A., Montanarella, L., Tye, A., and Obst, C. G.: Soil natural capital in Europe; a framework for state and change assessment, Sci. Rep.-UK, 7, 6706, https://doi.org/10.1038/s41598-017-06819-3, 2017.
Schjønning, P., van den Akker, J. J. H., Keller, T., Greve, M. H., Lamandé, M., Simojoki, A., Stettler, M., Arvidsson, J., and Breuning-Madsen, H.: Driver-Pressure-State-Impact-Response (DPSIR) analysis and risk assessment for soil compaction – a European perspective, in: Advances in Agronomy, edited by: Sparks, D. L., pp. 183–237, Academic Press, ISBN 9780128030523, 2015.
SMSS/USDA/AID: Keys to Soil Taxonomy. Soil Management Support Services, Technical Monograph no. 6, Prepared by Agronomy Department, Cornell University, Ithaca, NY, US, p. 244, 1983.
Stockmann, U., Padarian, J., McBratney, A., Minasny, B., de Brogniez, D., Montanarella, L., Hong, S. Y., Rawlins, B. G., and Field, D. J.: Global soil organic carbon assessment, Global Food Security, 6, 9–16, https://doi.org/10.1016/j.gfs.2015.07.001, 2015.
Sustainable Food Trust: Soil degradation: a major threat to humanity, Sustainable Food Trust, Bristol, UK, 2015.
Vossen, P.: Forecasting of national crop production: The methodologies developed in the Joint Research Centre in support to the Commission of European Communities, Advance in Remote Sensing, 2, 158–165, 1993.
Zeraatpisheh, M., Ayoubi, S., Jafari, A., Tajik, S., and Finke, P.: Digital mapping of soil properties using multiple machine learning in a semi-arid region, central Iran, Geoderma, 338, 445–452, https://doi.org/10.1016/j.geoderma.2018.09.006, 2019.
Zhang, G.-L., Liu, F., and Song, X.-D.: Recent progress and future prospect of digital soil mapping: A review, J. Integr. Agr., 16, 2871–2885, https://doi.org/10.1016/S2095-3119(17)61762-3, 2017.
- Abstract
- Introduction
- Establishing the soil profile analytical database for Europe framework (SPADE 1)
- An attempt to populate SPADE with measured data (SPADE 2)
- Steps towards full geographical coverage (SPADE 8)
- Establishing a SPADE for dominant soil types with full coverage of the EU (SPADE 14)
- Creating a pilot version of the SPADE 18 level-2 database (SPADE 18)
- SPADE applications: root zone capacity (RZC) and SOC stocks in Europe
- Limitations of our approach
- Concluding remarks
- Data availability
- Author contributions
- Competing interests
- Acknowledgements
- Financial support
- Review statement
- References