the Creative Commons Attribution 4.0 License.
the Creative Commons Attribution 4.0 License.
 | 08 Apr 2020
The 15N gas-flux method to determine N2 flux: a comparison of different tracer addition approaches
Dominika Lewicka-Szczebak
Reinhard Well
The 15N gas-flux method allows for the quantification of N2 flux and tracing soil N transformations. An important requirement for this method is a homogeneous distribution of the 15N tracer added to soil. This is usually achieved through soil homogenization and admixture of the 15N tracer solution or multipoint injection of tracer solution to intact soil. Both methods may create artefacts. We aimed at comparing the N2 flux determined by the gas-flux method using both tracer distribution approaches. Soil incubation experiments with silt loam soil using (i) intact soil cores injected with 15N label solution, (ii) homogenized soil with injected label solution, and (iii) homogenized soil with admixture of label solution were performed. Intact soil cores with injected 15N tracer solution show a larger variability of the results. Homogenized soil shows better agreement between repetitions, but significant differences in 15N enrichment measured in soil nitrate and in emitted gases were observed. For intact soil, the larger variability of measured values results rather from natural diversity of non-homogenized soil cores than from inhomogeneous label distribution. Generally, comparison of the results of intact cores and homogenized soil did not reveal statistically significant differences in N2 flux determination. In both cases, a pronounced dominance of N2 flux over N2O flux was noted. It can be concluded that both methods showed close agreement, and homogenized soil is not necessarily characterized by more homogenous 15N label distribution.
- Article
(669 KB) - Full-text XML
- BibTeX
- EndNote


Determination of soil nitrogen transformation pathways and quantification of gaseous N emissions often requires soil incubation experiments including significant manipulations of natural soil conditions. In particular, the quantification of soil N2 flux in field studies is very challenging due to high atmospheric background. The most common method for both detailed tracing of soil N transformations and determination of N2 emission is the application of 15N tracer (Aulakh et al., 1991; Baily et al., 2012; Bergsma et al., 2001; Buchen et al., 2016; Deppe et al., 2017; Kulkarni et al., 2013; Morse and Bernhardt, 2013; Müller et al., 2004, 2014; Well et al., 2019). However, this can have a significant impact on the soil due to additional fertilization and soil disturbance depending on the method of tracer addition (Murphy et al., 2003). The impact associated with soil fertilization can be minimized by applying the lowest effective fertilizer doses. To determine soil gross N transformation rates, enrichment in 15N of a few percent (e.g. 10 atom % 15N) is sufficient (Müller et al., 2004). However, in applications where N2 fluxes are analysed (15N gas-flux method) the 15N-labelled N pool (e.g. ) should ideally be enriched by approximately 50 atom % 15N to achieve precise results (Stevens et al., 1993). The impact of soil disturbance is often minimized by 15N tracer application to the intact soil cores (Rütting et al., 2011).
The 15N gas-flux method is based on the assumption of an isotopically homogenous pool. Failure to fulfil this condition, which is often the case, may result in underestimation of denitrification rates up to 30 % (Arah, 1997; Mulvaney, 1984). An initial homogeneity can be obtained through intensive mixing of the soil, but this is a massive disturbance with huge potential effects on N processes, including denitrification dynamics. However, application of intact soil cores can enhance problems with homogeneous 15N label distribution, since incomplete equilibration of water content after injecting aqueous tracer solution could lead to increased wetness near the injection spots and to enhanced denitrification (Wu et al., 2012). Hence, for the 15N gas-flux method a compromise must be found between homogeneous 15N label distribution, which is crucial for N2 flux calculations, and a possibly minimal change of the real soil N transformations.
The two most common strategies for the tracer addition to the soil are the following: (i) soil homogenization where the tracer solution is mixed with the soil (ii) or use of intact soil cores where tracer solution is added through multiple needle injections (Davidson et al., 1991). Both methods lead to potential bias. Following soil homogenization, the soil structure is changed through sieving and mixing (Gütlein et al., 2016; Kaur et al., 2010); roots and stones are removed, which should result in the best achievable homogeneity of soil properties and tracer distribution within the soil column and thus better comparability between the repetitions (Well et al., 2006). For needle injections, the soil structure stays unchanged, but the pointwise injection may not ensure the homogenous distribution of the tracer (Davidson et al., 1991). Here we aimed to compare the results of these different strategies and test how far the determined 15N-pool-derived N2 and N2O fluxes are altered due to a particular soil treatment.
2.1 Experimental set-up
Silt loam soil Albic Luvisol from arable cropland of Merklingsen experimental station (Germany) was used (silt content approx. 87 %, 11 % clay, 2 % sand). Three treatments were applied: (1) soil was sieved with 4 mm mesh size, the tracer solution was added evenly, soil was homogenized and packed into the incubation column (treatment H + M: homogenized + mixed); (2) intact soil cores were directly collected in the incubation columns and the tracer solution was added through the injection needles to 12 homogeneously distributed injection points at 6 depths (in total 72 injection points per column) (treatment I + I: intact + injected); (3) soil was sieved with 4 mm mesh size (like in treatment H + M), packed into the incubation column, and the tracer solution was added through the injection needles (like in treatment I + I) (treatment H + I: homogenized + injected). For each treatment the soil columns were 0.3 m high with a diameter of 0.15 m. A mesh size of 4 mm was used because this enabled us to sieve the necessary amount of soil (56 kg) within an adequate time. The soil density of intact cores was 1.3 g cm−3, and the packed columns were compacted to the same density. Each column contained 6.89 kg soil. For each soil column, 216 mL of 319 mgN L−1 NaNO3 solution with 73 atom % 15N was added. This resulted in the following initial experimental settings: 75 % water-filled pores space (WFPS), 37 mg N kg−1 , 42.5 atom % 15N measured in the subsamples of the homogenized soil immediately after tracer addition and mixing. The incubation lasted 8 d. The columns were continuously flushed with a gas mixture with reduced N2 content to increase the measurement sensitivity (2 % N2 and 21 % O2 in He; Lewicka-Szczebak et al., 2017) with a flow of 10 mL min−1. The gas samples were collected daily in the first 4 d and every second day in the last 4 d in two 12 mL septum-capped Exetainers® (Labco Limited, Ceredigion, UK) connected to the vents of the incubation columns.
2.2 Gas analyses
The gas samples were analysed with a modified GasBench II preparation system coupled with a MAT 253 isotope ratio mass spectrometer (Thermo Scientific, Bremen, Germany) according to Lewicka-Szczebak et al. (2013). In this set-up, N2O is converted to N2 prior to analysis, which allows the simultaneous measurement of stable isotope ratios 29R (29N2∕28N2) and 30R (30N2∕28N2), of N2, of the sum of denitrification products (N2+N2O) and of N2O. Based on these measurements the following values were calculated according to the respective equations (after Spott et al., 2006).
The 15N abundance of 15N-labelled pool (aP), from which N2 ( or N2O ( originates, is calculated as follows:
The calculation of aP is based on the non-random distribution of N2 and N2O isotopologues (Spott et al., 2006), where 30xM is the fraction of 30N2 in the total gas mixture:
aM is 15N abundance in total gas mixture:
abgd is 15N abundance of non-labelled pool (atmospheric background or experimental matrix).
The fraction originating from the 15N-labelled pool (fP) for N2 (), N2+N2O (), and N2O () within the sample is calculated as follows:
N2O residual fraction ( represents the unreduced N2O mole fraction of pool-derived gross N2O production (Lewicka-Szczebak et al., 2017):
where y represents the mole fractions.
2.3 Soil analyses
At the end of incubation, soil samples were collected from each column using a Goettinger boring rod with a diameter of 18 mm (Nietfeld GmbH, Quakenbrück, Germany). Three cores were taken from each column and separated into a top (0 to 15 cm) and bottom (15 to 30 cm) layer. For injected treatments ((H + I) and (M + I)) these sample cores were taken between injection points, and additional cores were collected from the injection points. All soil samples were homogenized and analysed for water content (by weight loss after 24 h drying in 110 ∘C), nitrate content (by extraction in 2 M KCl 1:4), and 15N enrichment in nitrate (with the bacterial denitrification method of Sigman et al., 2001).
2.4 Statistics
For testing the statistical significance of the differences between treatments, ANOVA and Tukey HSD post hoc test were applied using R 3.4.2 (R Core Team, 2013).
In Table 3, for the comparison of particular and aP values, we applied the following calculated parameters:
-
cumulative relative difference (cumulated diff) calculated as the sum of differences in 15N enrichment of different pools for all 24 samples: cumulated diff ;
-
absolute mean difference (mean abs diff) calculated as the mean of modulus of differences in 15N enrichment of different pools: mean abs diff .
In the above equations a1 and a2 represent the 15N enrichment of two compared pools ( or or .
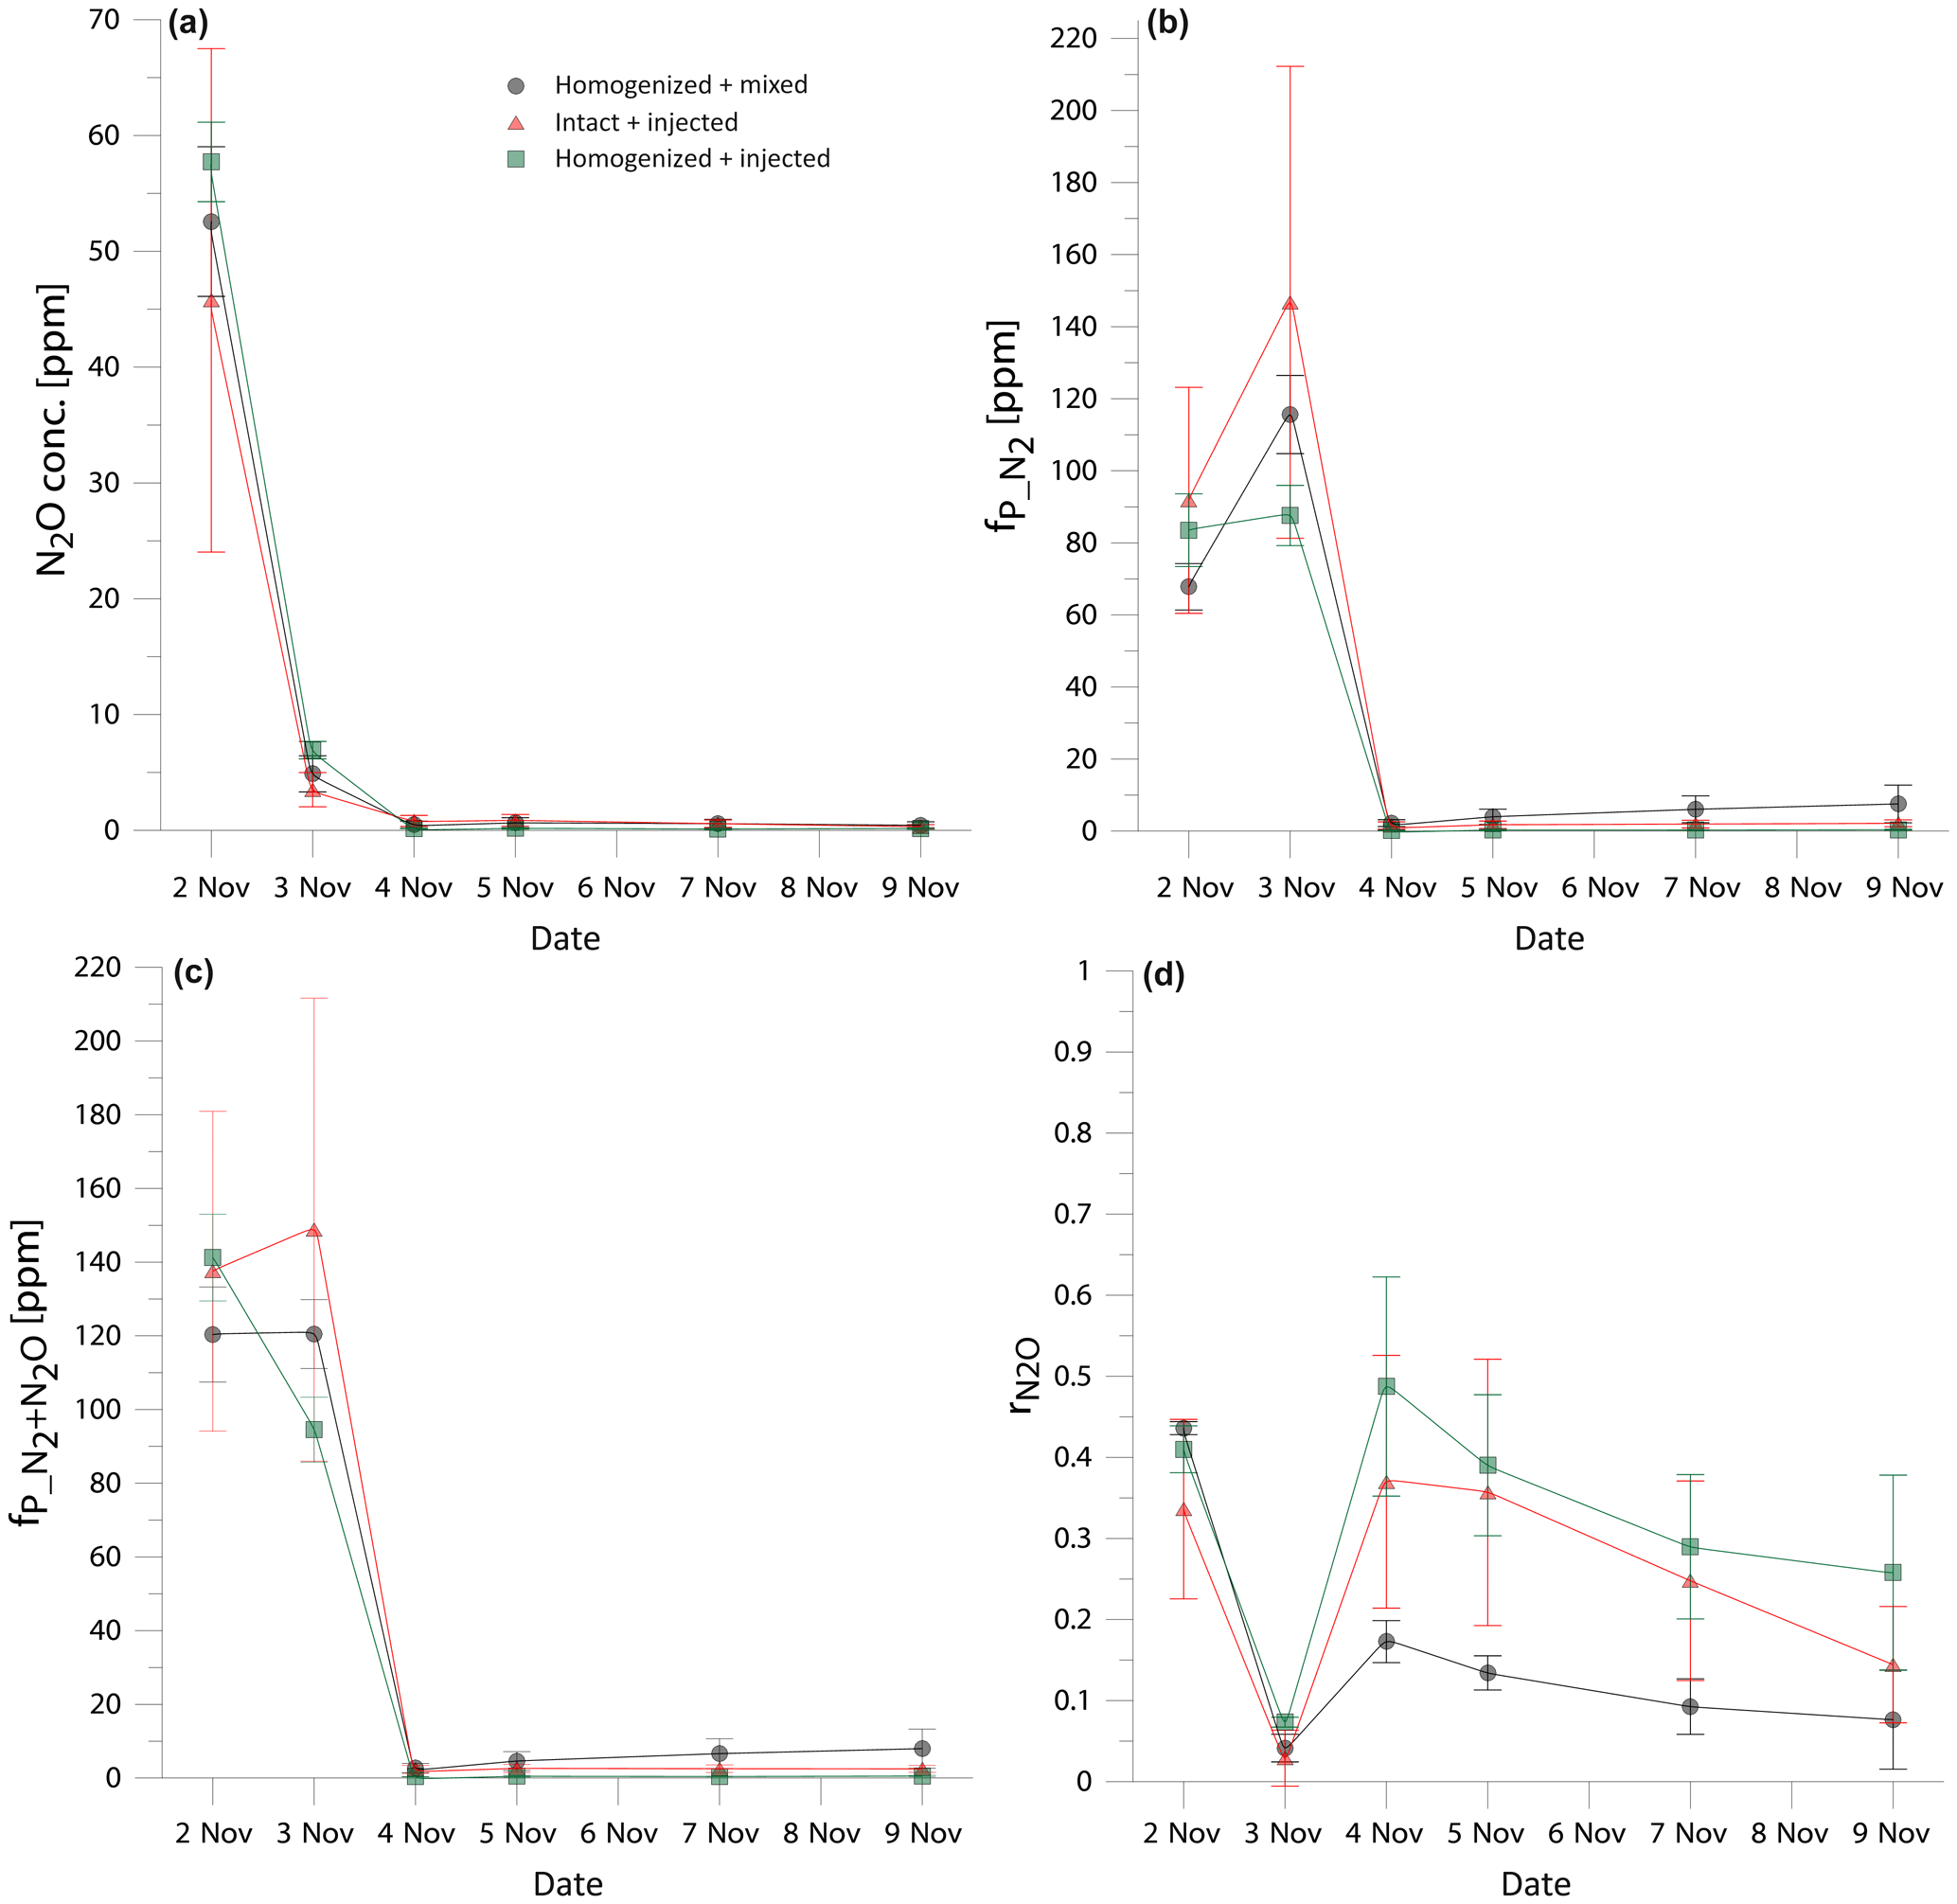
Figure 1Comparison of the temporal changes in N2O concentration (a), fraction of 15N-pool-derived N2 (b), fraction of 15N-pool-derived denitrification products (N2+N2O) (c), and N2O residual fraction (d) in three treatments: homogenized soil mixed with fertilizer (black dots), intact soil cores with fertilizer added through needle injection (red triangles), and homogenized soil with fertilizer added through needle injection (green squares). Error bars represent the standard deviation of four replicates within one treatment.
3.1 Gas fluxes and denitrification product ratio
In order to compare the treatments, the time course of the results must be taken into account as the gas production differed largely between the sampling dates (Fig. 1). Therefore, we checked for statistically significant differences between the treatments individually for each sampling date. The results show comparable trends and no statistically significant differences between treatments (Fig. 1). Notably, shows very good agreement at the beginning of the experiment, when the large gas concentrations were measured and starts to differentiate when the fluxes drop from the third day (Fig. 1d), but these differences are not statistically significant. However, if the experiment is evaluated for the cumulative values, significant differences between treatments appear (Table 1). The cumulated gas fluxes of N2O and N2 are significantly different between the treatments I + I and H + I, whereas the H + M treatment does not differ significantly from the others. However, comparison of the entire denitrification gas flux (joint N2+N2O flux) reveals no statistically significant difference between treatments (Table 1). Product ratios are compared as cumulated (calculated with the cumulated fluxes) and mean (average value of all sampling points). Cumulated shows an identical pattern of significant differences as the cumulated N2 and N2O fluxes. For mean values, H + M and H + I treatment are significantly different, whereas the I + I treatment does not differ significantly from the others.
These results show that the different tracer application strategies tested had no impact on the total denitrification (N2+N2O), but the product ratio may be slightly shifted, which results in differences by comparing N2 or N2O flux separately. This presumably results from the differences in distribution of moisture and nitrate between treatments (see Sect. 3.2). All determined values, although partially different, indicate a pronounced dominance of N2 over N2O emission. Importantly, no significant differences were noted between the H + M and I + I treatment; only the H + I treatment shows higher N2O flux, lower N2 flux and higher (Table 1). In this treatment we probably observe joint artefacts associated with soil homogenization and needle injection technique.
The homogenized treatments show better comparability between the repetitions – they show lower standard deviations for gas emissions and for (Table 1) and smaller error bars for the daily measurements (Fig. 1). The H + I treatment shows the lowest standard deviations for the cumulative gas emission measurements (Table 1). This indicates that the observed heterogeneity for I + I treatment is not due to needle injection procedure but rather due to the intact structure of soil cores, which naturally represents the typical soil heterogeneity.
3.2 Soil parameters
In this study the high dose of added N resulted in more than doubled content. This was much above the common recommendations of tracer addition of 10 %–25 % of native soil N (Davidson et al., 1991). These recommendations are motivated by the need to minimize the fertilization effect and to trace the naturally occurring N transformation processes. But in this study we only aimed to compare tracer addition strategies and did not intend to draw conclusions for this particular study site. Establishing a high 15N enrichment of the by high addition of 15N-labelled enhanced the sensitivity of N2 flux detection, which is a prerequisite for reliably identifying potential experimental artefacts, which we aimed to evaluate in this study.
A good insight into heterogeneity within columns is also provided by the soil analyses performed at the end of experiment, by collecting samples from various areas of each soil core (Table 2). Clearly, I + I treatment shows the largest standard deviations between repetitions. Also, the most pronounced differences between top and bottom soil layer can be noted for this treatment, but only soil moisture is significantly lower for the bottom layer. Since this is not the case for H + I treatment, it reflects the natural heterogeneity of intact cores rather than a result of label injection procedure. The values from injection points are never significantly different from samples between injection points (within one treatment), which indicates a good distribution of the tracer solution (Table 2).
Table 1Comparison of cumulated fluxes, cumulated product ratio (cumulated ) and mean product ratios (mean ) in three treatments: homogenized and mixed (H + M), intact and injected (I + I), homogenized and injected (H + I). Statistically significant differences are indicated with superscript letters (* p<0.05, p<0.01, p<0.001).
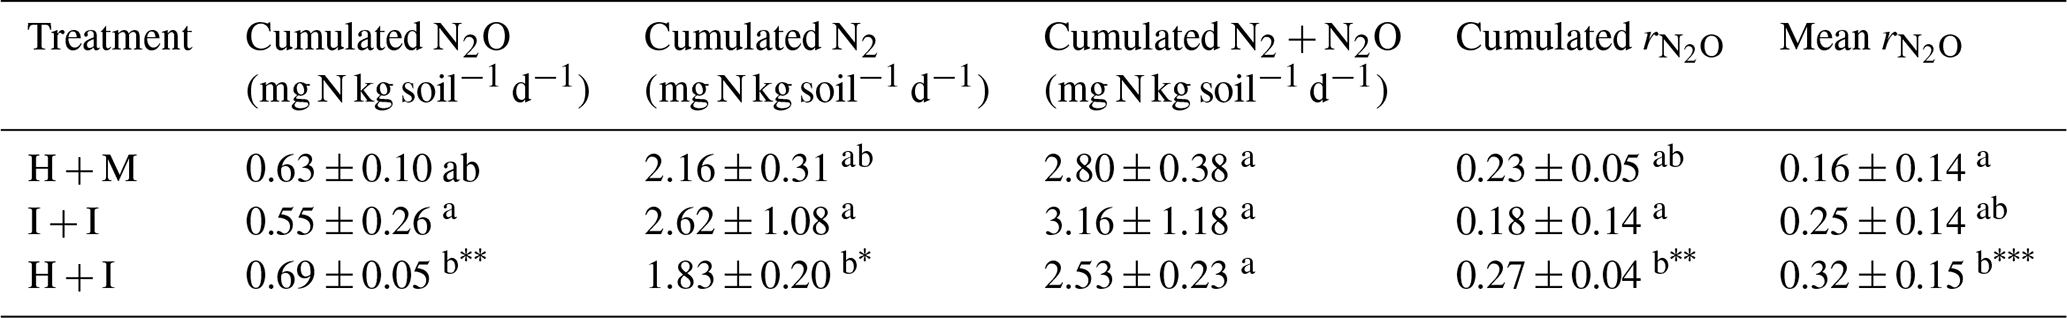
Table 2Soil analyses at the end of the experiment: mixed samples, and separately from the top and bottom layer and for injected columns also from injection points (including both top and bottom layer). Statistically significant differences are indicated with superscript letters (p<0.01, p<0.001). For individual values the differences within treatment were tested, and for mean values the differences between treatments were tested.
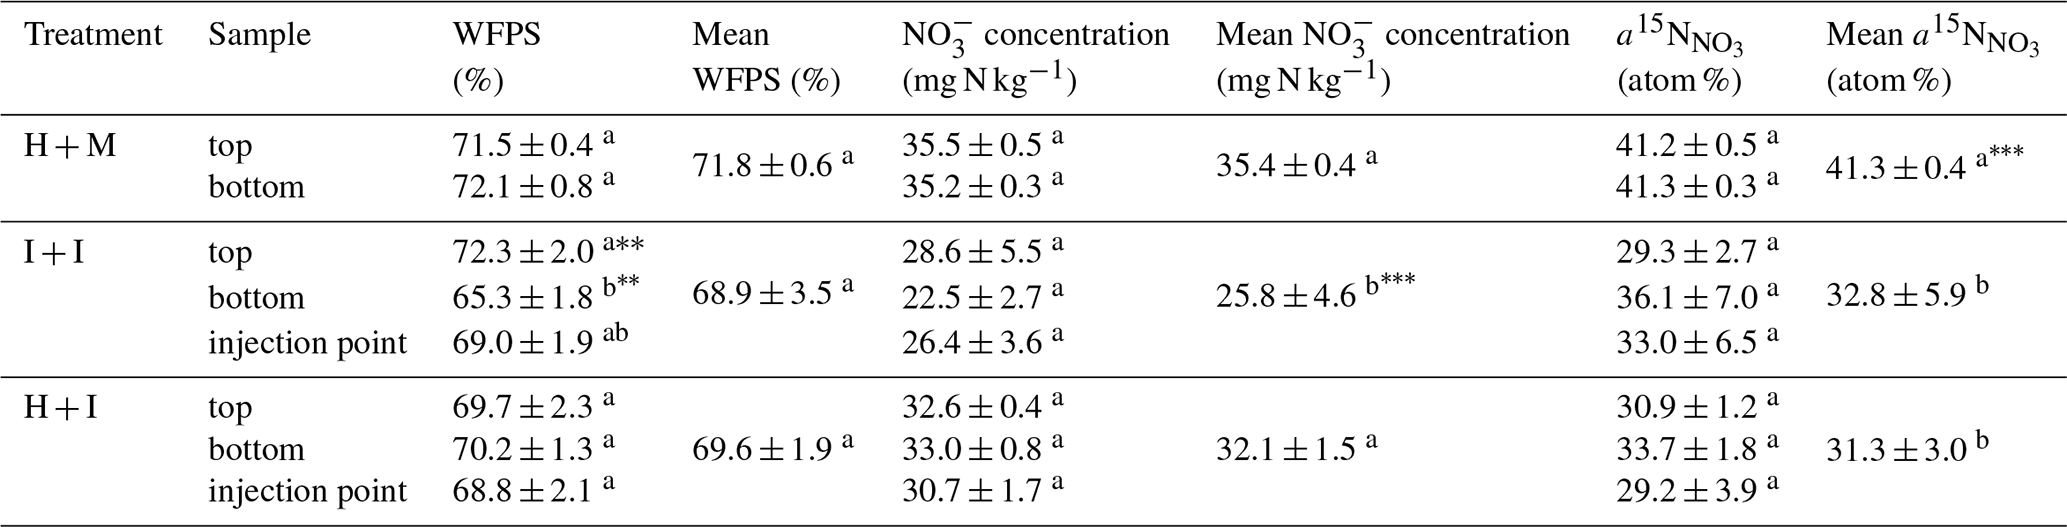
Significant differences in soil parameters between treatments (Table 2) were observed. The I + I treatment shows significantly lower nitrate content compared to homogenized treatments (Table 2). This must be due to initial soil nitrate content. The soil was stored for 2 weeks before the experiment. Storing of mixed soil or sieving and homogenization procedures probably intensified N mineralization and the formation of additional nitrate through intensified nitrification, which has also been observed in previous studies (Kaur et al., 2010). Moreover, the H + M treatment shows significantly higher 15N enrichment of () than injected treatments. This may be due to injection procedure where the needles might get partially clogged with soil causing the addition of tracer solution to be lower than planned. The assumption that the injected volume was lower than the target and thus also lower than the addition of tracer solution to H + M treatment can also be supported by the slightly lower soil moisture and nitrate content of the injected treatments.
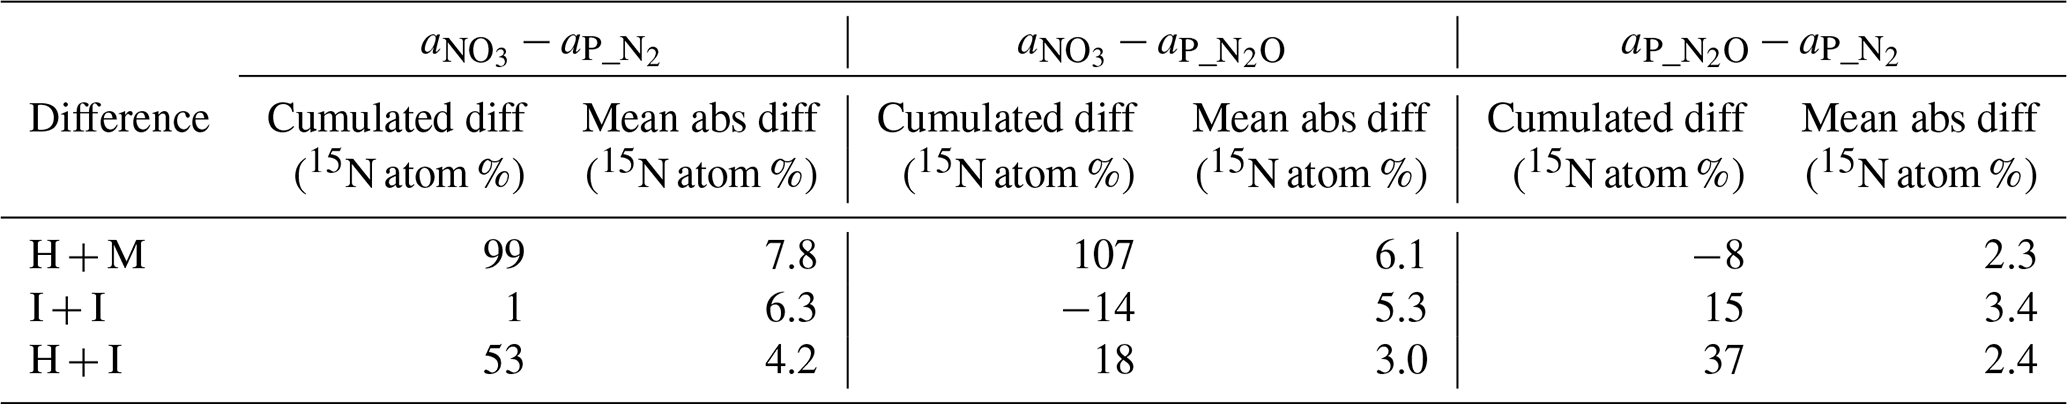
Table 3Differences between the measured 15N abundance in soil nitrate () and determined 15N abundance of 15N-pool-derived N2 () and N2O () expressed as the cumulative relative difference for all samples (n=24), mean absolute difference (see Sect. 2.4 for calculation procedure). In the above equations a1 and a2 represent the 15N enrichment of two compared pools ( or or ).
3.3 15N abundance in soil active pools
Despite the pronounced difference in 15N content between treatments, the results can still be compared because the 15N abundance of actively denitrifying pool (aP value) for each sample is individually calculated based on the distribution of N2 and N2O isotopologues. We checked how well these calculated aP values for N2 and N2O correspond with the respective 15N enrichment measured in soil nitrate () and between each other (Table 3). This comparison gives additional information about the distribution of the 15N label. The cumulative relative difference represents the overall deviation between the analysed pools. Very high cumulative difference was noted between the aP values of both gases and in H + M treatment. This is mostly due to the first two sampling days, where aP values were significantly lower than (mean difference of ca. 15 atom % 15N, Fig. 2), whereas for the next samplings they corresponded very well (mean difference of ca. 1 atom % 15N, Fig. 2). This shows that initially the gases were produced in soil microsites depleted in 15N compared to the mean soil value. This is the case for all three treatments; however, the largest difference is observed for H + M treatment due to highest values. The absolute mean difference represents the average variation range of the compared values. For the comparison of mean absolute difference between and , we obtained quite a good agreement, much better than for the comparisons with (Table 3). This shows that both gases originate mostly from the same soil pool. Importantly, even in the H + M treatment where large mean difference between and aP values was noted, the mean difference between and is very low. The fact that shows much closer agreement with than suggests that, when missing data on , which is often the case due to high N2 detection limit of the gas-flux method, the should be used rather than or a theoretical value on 15N abundance, as has also been proposed in previous studies (Bergsma et al., 2001; Stevens and Laughlin, 2001).
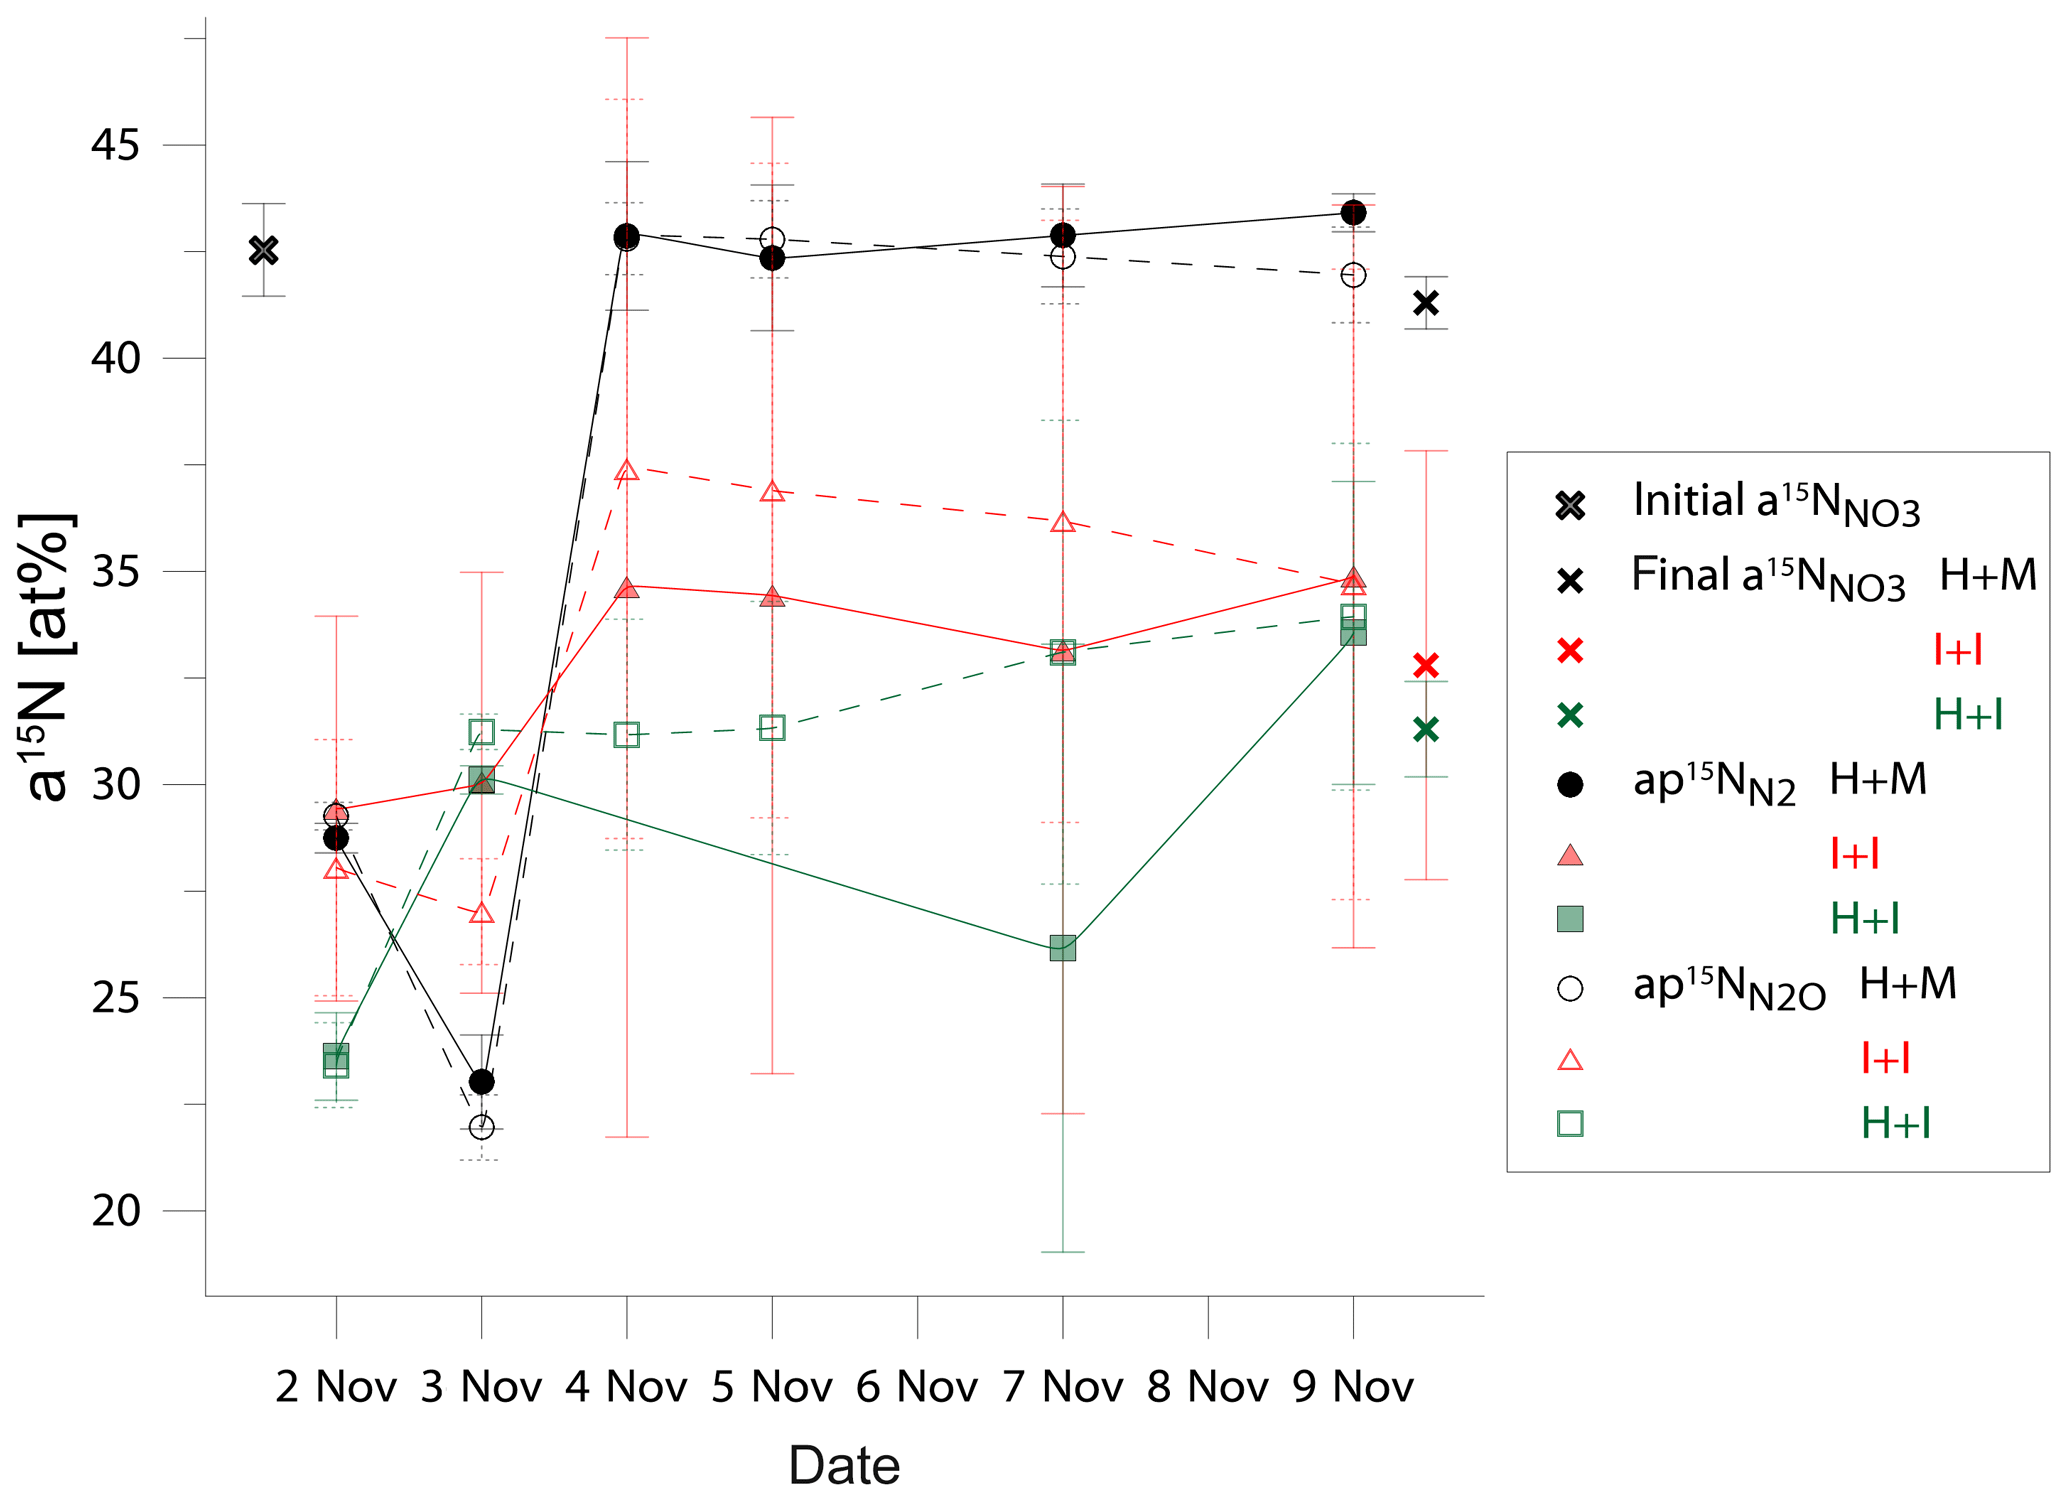
Figure 2Comparison of 15N abundance in total initial and final soil nitrate ( and in active soil pool emitting N2 (N and N2O (N in three treatments: homogenized soil and mixed fertilizer (H + M, black points)), intact soil core and injected fertilizer (I + I, red points), homogenized soil and injected fertilizer (H + I, green points).
Interestingly, for the I + I treatment lower differences between and or values were obtained, but there was a larger difference between and compared to homogenized treatments (Table 3, Fig. 2). This shows that the multiple-injection technique reduced the formation of isolated soil microsites characterized by distinct 15N enrichment when compared to the bulk value measured. However, the slightly higher difference between aP values for N2 and N2O suggests non-identical origins for both gases, i.e. probable slight admixture of hybrid N2 (Spott et al., 2011) since the 15N enrichment of N2 shows lower values than N2O. This could explain the higher cumulated N2 flux for I + I treatment (Table 1).
3.4 Homogeneity of 15N tracer distribution and accuracy of results
Surprisingly, the inconsistency in 15N abundance in total and actively denitrifying nitrate soil pools (Fig. 2) indicates the largest inhomogeneity at the beginning of the incubation for the homogenized soil, which is then equilibrated after 2 d of incubation. This resulted most probably from the imperfect mixing of the relatively wet (gravimetric water content of 29.3 %) silt loam soil and could be due to delayed equilibration of added 15N solution into the centre of soil aggregates where denitrification rates are probably highest (Sextone et al., 1985). But, importantly, these first two days are also the ones with the highest gas production and close agreement of results between all three treatments (see Fig. 1). This suggests that even non-homogeneous distribution of 15N label and thus heterogeneity in content and 15N enrichment of nitrate in soil does not lead to severe bias in determining denitrification and its product ratio.
This study allows only for the comparison of these different treatments but not for checking the true emission values, since we have not used any independent method for flux determination. However, we can conclude that, despite pronounced differences in a15N values of different treatments and different pools, the calculated results for gas fluxes and product ratios were mostly not significantly different between the treatments. This supports the assumption that in a real soil situation even imperfect label distribution allows for obtaining accurate results (Arah, 1997; Davidson et al., 1991; Deppe et al., 2017). But, importantly, this is possible only if we measure and use aP values representing the 15N values of the pools actively producing N2 and N2O. The fluxes would be significantly underestimated if the value was applied for calculations. For example, for the first sampling point this would result in about a 20 % underestimation of the N2 flux when the measured final value was applied and an about 30 % underestimation when the initial value was applied. Significant differences in 15N enrichment of total and active nitrate pool have also been found in our previous laboratory and field studies (Buchen et al., 2016; Deppe et al., 2017). It was shown that in such cases the 15N enrichment of N pool undergoing denitrification is well represented by aP values but not by values.
The homogeneity of 15N label distribution depends not only on the tracer addition technique but even more on the soil type, water content, and initial nitrate and ammonium content. In our previous laboratory experiments quite a good agreement between values and aP values was achieved, indicating a homogenous denitrifying pool (Lewicka-Szczebak et al., 2017). In that study similar soil texture was used (silt loam), but the initial amount of nitrate and ammonium was very low, and soil samples were prepared at soil moisture of 70 % WFPS with rest water added on top, and soil was incubated in high moisture conditions. But, notably, the anoxic conditions showed perfect agreement in and aP values, whereas for oxic conditions slight differences have also been noted (Lewicka-Szczebak et al., 2017). Oxic conditions can be expected to yield greater disagreement between and aP due to dilution of the bulk by soil-derived non-labelled N sources in contrast to anoxic soil microsites (Deppe et al., 2017). In the H + M treatment of the actual experiment, inhomogeneity was probably the result of soil moisture during soil homogenization being too high (75 % WFPS), causing the formation of larger aggregates. But this problem can be overcome if the 15N label is incorporated at low soil moisture and target moisture is established by adding water afterwards (Lewicka-Szczebak et al., 2017; Well et al., 2019).
Soil homogenization reduced the variability within the soil column and between repetitions but not necessarily improved the 15N label distribution. Wet homogenization has led to uneven label and process distribution. Multiple needle injections of 15N solution resulted in better agreement between 15N enrichment of soil and emitted gases, indicating even more homogeneous 15N label distribution than homogenized treatments.
Larger heterogeneity of intact soil cores, noted as larger deviations of all measured values, reflects the natural soil conditions rather than inhomogeneous 15N label distribution. Importantly, the results obtained with homogenized soil and with intact soil cores do not differ significantly in the determined N2 flux and denitrification product ratio. Hence, when applying each of these treatments, very similar general conclusions will be found, i.e. the dominance of the N2 flux over the N2O flux. This good accordance is thanks to the calculation method applying aP values determined individually for each sample. This assures the adequate results for flux calculation, even with the existence of multiple N pools. It was found that values can differ greatly from the aP value of produced gases, and its application for N2 flux determination may result in large bias.
In this study only one soil with one moisture level was tested, and this experiment was conducted with high doses of 15N-labelled fertilizer. Since the indicated artefacts due to homogenization and mixing depend on soil properties (such as organic matter properties, pore structure, microbial community dynamics, or heterogeneity of label and water distribution), for more universal conclusions further studies with different soils, moisture levels, and 15N label additions should be conducted. Meanwhile, to minimize methodical bias in future studies using the 15N gas-flux method, our approach could be used to test labelling artefacts for specific soil conditions.
Original data are available upon request. Material necessary for this study's findings is presented in the paper.
DLS and RW designed the experiment, and DLS carried it out. Both authors interpreted the results. DLS prepared the manuscript with significant contributions from RW.
The authors declare that they have no conflict of interest.
Many thanks are due to Frank Hegewald and Nicolas Ruoss for help in the collection of soil cores and setting up laboratory incubations, Stefan Burkart for help in carrying out soil incubation, Martina Heuer for help in isotopic analyses, Nicole Altwein and Ute Tambor for help in soil analyses, and Kerstin Gilke for help in chromatographic analyses.
This research has been supported by the Deutsche Forschungsgemeinschaft (grant no. LE 3367/1-1).
This paper was edited by Karsten Kalbitz and reviewed by two anonymous referees.
Arah, J. R. M.: Apportioning nitrous oxide fluxes between nitrification and denitrification using gas-phase mass spectrometry, Soil Biol. Biochem., 29, 1295–1299, 1997.
Aulakh, M. S., Doran, J. W., and Mosier, A. R.: Field-Evaluation of 4 Methods for Measuring Denitrification, Soil Sci. Soc. Am. J., 55, 1332–1338, 1991.
Baily, A., Watson, C. J., Laughlin, R., Matthews, D., McGeough, K., and Jordan, P.: Use of the 15N gas flux method to measure the source and level of N2O and N2 emissions from grazed grassland, Nutr. Cycl. Agroecosys., 94, 287–298, 2012.
Bergsma, T. T., Ostrom, N. E., Emmons, M., and Robertson, G. P.: Measuring simultaneous fluxes from soil of N2O and N2 in the field using the 15N-Gas “nonequilihrium” technique, Environ. Sci. Technol., 35, 4307–4312, 2001.
Buchen, C., Lewicka-Szczebak, D., Fuß, R., Helfrich, M., Flessa, H., and Well, R.: Fluxes of N2 and N2O and contributing processes in summer after grassland renewal and grassland conversion to maize cropping on a Plaggic Anthrosol and a Histic Gleysol, Soil Biol. Biochem., 101, 6–19, 2016.
Davidson, E. A., Hart, S. C., Shanks, C. A., and Firestone, M. K.: Measuring Gross Nitrogen Mineralization, Immobilization, and Nitrification by N-15 Isotopic Pool Dilution in Intact Soil Cores, J. Soil Sci., 42, 335–349, 1991.
Deppe, M., Giesemann, A., Well, R., Spott, O., and Flessa, H.: Soil N2O fluxes and related processes in laboratory incubations simulating ammonium fertilizer depots, Soil Biol. Biochem., 104, 68–80, 2017.
Gütlein, A., Dannenmann, M., and Kiese, R.: Gross nitrogen turnover rates of a tropical lower montane forest soil: Impacts of sample preparation and storage, Soil Biol. Biochem., 95, 8–10, 2016.
Kaur, A. J., Ross, D. S., and Fredriksen, G.: Effect of soil mixing on nitrification rates in soils of two deciduous forests of Vermont, USA, Plant Soil, 331, 289–298, 2010.
Kulkarni, M. V., Burgin, A. J., Groffman, P. M., and Yavitt, J. B.: Direct flux and 15N tracer methods for measuring denitrification in forest soils, Biogeochemistry, 117, 359–373, 2013.
Lewicka-Szczebak, D., Well, R., Giesemann, A., Rohe, L., and Wolf, U.: An enhanced technique for automated determination of 15N signatures of N2, (N2+N2O) and N2O in gas samples, Rapid Commun. Mass Sp., 27, 1548–1558, 2013.
Lewicka-Szczebak, D., Augustin, J., Giesemann, A., and Well, R.: Quantifying N2O reduction to N2 based on N2O isotopocules – validation with independent methods (helium incubation and 15N gas flux method), Biogeosciences, 14, 711–732, https://doi.org/10.5194/bg-14-711-2017, 2017.
Morse, J. L. and Bernhardt, E. S.: Using 15N tracers to estimate N2O and N2 emissions from nitrification and denitrification in coastal plain wetlands under contrasting land-uses, Soil Biol. Biochem., 57, 635–643, 2013.
Müller, C., Stevens, R. J., and Laughlin, R. J.: A N-15 tracing model to analyse N transformations in old grassland soil, Soil Biol. Biochem., 36, 619–632, 2004.
Müller, C., Laughlin, R. J., Spott, O., and Rütting, T.: Quantification of N2O emission pathways via a 15N tracing model, Soil Biol. Biochem., 72, 44–54, 2014.
Mulvaney, R. L.: Determination of N-15-Labeled Dinitrogen and Nitrous-Oxide with Triple-Collector Mass Spectrometers, Soil Sci. Soc. Am. J., 48, 690–692, 1984.
Murphy, D. V., Recous, S., Stockdale, E. A., Fillery, I. R. P., Jensen, L. S., Hatch, D. J., and Goulding, K. W. T.: Gross nitrogen fluxes in soil: theory, measurement and application of 15N pool dilution techniques, Adv. Agron., 79, 69–118, 2003.
R Core Team: R: A language and environment for statistical computing, R Foundation for Statistical Computing, Vienna, Austria, URL: http://www.R-project.org/ (last access: 2 September 2019), 2013.
Rütting, T., Huygens, D., Staelens, J., Müller, C., and Boeckx, P.: Advances in 15N-tracing experiments: new labelling and data analysis approaches, Biochem. Soc. T., 39, 279–283, 2011.
Sextone, A. J., Revsbech, N. P., Parkin, T. B., and Tiedje, J. M.: Direct Measurement of Oxygen Profiles and Denitrification Rates in Soil Aggregates, Soil Sci. Soc. Am. J., 49, 645–651, 1985.
Sigman, D. M., Casciotti, K. L., Andreani, M., Barford, C., Galanter, M., and Bohlke, J. K.: A bacterial method for the nitrogen isotopic analysis of nitrate in seawater and freshwater, Anal. Chem., 73, 4145–4153, 2001.
Spott, O., Russow, R., Apelt, B., and Stange, C. F.: A N-15-aided artificial atmosphere gas flow technique for online determination of soil N2 release using the zeolite Kostrolith SX6 (R), Rapid Commun. Mass Sp., 20, 3267–3274, 2006.
Spott, O., Russow, R., and Stange, C. F.: Formation of hybrid N2O and hybrid N2 due to codenitrification: First review of a barely considered process of microbially mediated N-nitrosation, Soil Biol. Biochem., 43, 1995–2011, 2011.
Stevens, R. J. and Laughlin, R. J.: Lowering the detection limit for dinitrogen using the enrichment of nitrous oxide, Soil Biol. Biochem., 33, 1287–1289, 2001.
Stevens, R. J., Laughlin, R. J., Atkins, G. J., and Prosser, S. J.: Automated-Determination of Nitrogen-15-Labeled Dinitrogen and Nitrous-Oxide by Mass-Spectrometry, Soil Sci. Soc. Am. J., 57, 981–988, 1993.
Well, R., Kurganova, I., de Gerenyu, V. L., and Flessa, H.: Isotopomer signatures of soil-emitted N2O under different moisture conditions – A microcosm study with arable loess soil, Soil Biol. Biochem., 38, 2923–2933, 2006.
Well, R., Burkart, S., Giesemann, A., Grosz, B., Köster, J. R., and Lewicka-Szczebak, D.: Improvement of the 15N gas flux method for in situ measurement of soil denitrification and its product stoichiometry, Rapid Commun. Mass Sp., 33, 437–448, 2019.
Wu, H., Dannenmann, M., Wolf, B., Han, X., G., Zheng, X., and Butterbach-Bahl, K.: Seasonality of soil microbial nitrogen turnover in continental steppe soils of Inner Mongolia, Ecosphere, 3, 1–18, 2012.